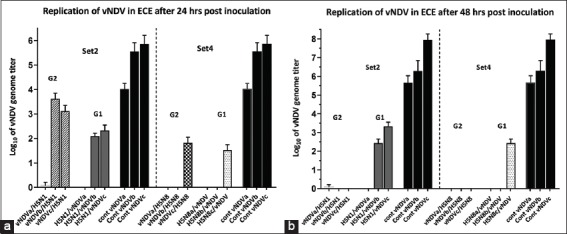
Figure-3.

(a and b) The replication titers of vNDV in sets 2 and 4. Set 2 [G2 (vNDV/H5N1), G1 (H5N1/vNDV)]. Set 4 [G2 (vNDV/H5N8), G1 (H5N8/vNDV)]. Black columns represent the positive control group (single vNDV inoculation). a-c represent three different inoculated titers (2, 3, and 4 log10, respectively). Bars over the columns represent the error bars of standard deviation to the mean titers. p<0.05. a is related to 24 h incubation, b is related to 48 h incubation.
