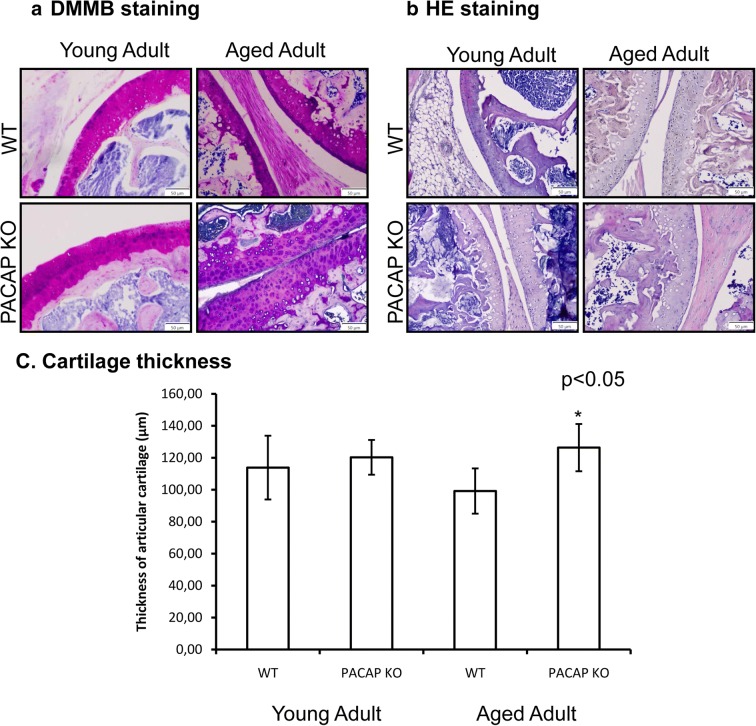
Fig. 2.
Morphological analysis of knee joints of young and aged WT and PACAP KO mice. Dimethylmethylene blue (DMMB) (a) and hematoxylin-eosin (HE) staining (b) were used to visualize the histological differences. Original magnification was × 20. Scale bar: 50 μm. Geometric analysis (c) of mouse articular cartilage. Representative data of 10 independent experiments. Asterisks indicate significant (*p < 0.05) difference in thickness of cartilage compared to the respective control

