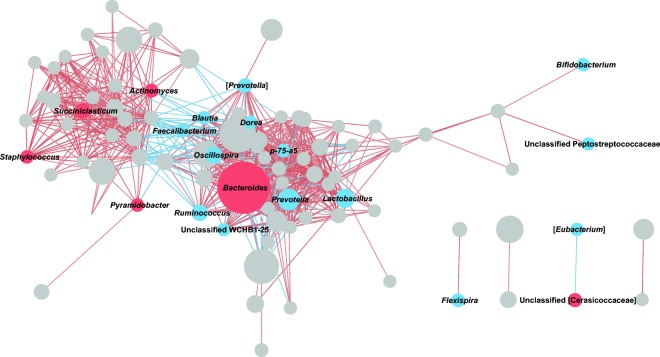
Fig. 5.
Spearman correlation network of gut microbiome genera. Each node represents a genus, and node size indicates the average relative abundance of the genus. Red and blue nodes indicate genera positively and negatively associated with age, respectively. The entire list of correlations with FDRs < 0.1 and coefficient values > 0.5 or < − 0.5 is shown in Supplemental Table S1

