
Fig. 4.
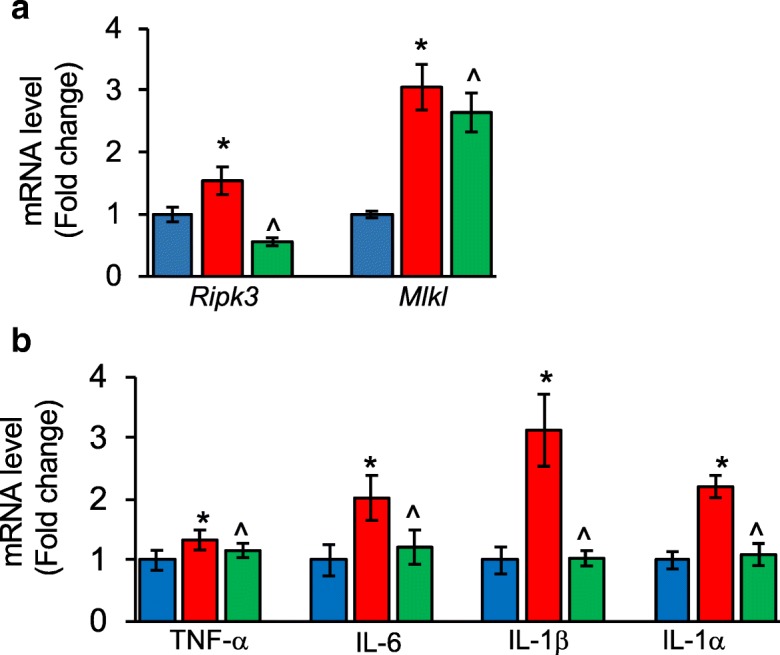
Necroptosis and inflammation in the liver of Sod1−/− mice. Transcript levels of Ripk3 and Mlkl (a), and transcript levels of TNF-α, IL-6, IL-1β and IL-1α (b) in the liver of 5-month-old control mice (blue bar), Sod1−/− mice (red bar), and Sod1−/−Ripk3+/− mice (green bar), normalized to β-actin. Data shown are mean ± SEM of 5 to 8 mice per group. p < 0.05 is taken as significant for the following: *control vs Sod1−/−; ^Sod1−/− vs Sod1−/−Ripk3+/−