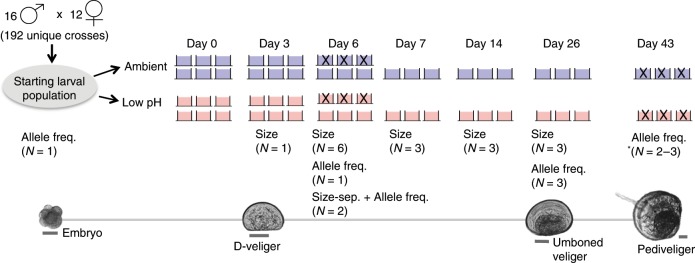
Fig. 1. Experimental schematic.
Pictures of larvae at key developmental points, cross design, and replication and sampling strategy throughout the experiment. Scale bar for larval pictures set at 50 μm. Blue and red buckets correspond to ambient and low-pH treatments, respectively. Replicate buckets marked with an “X” were destructively sampled (i.e., all larvae removed/preserved) and thus absent from the experimental system on subsequent sampling days. *Allele frequency data from two replicate buckets in the ambient treatment was generated on day 43, as the third replicate bucket was sacrificed to optimize protocol for sampling settled larvae.

