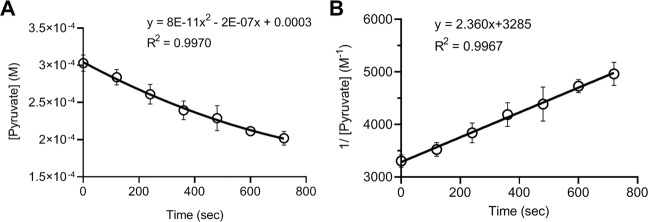
Figure 3.
Rate constant of pyruvate and H2O2 reaction. Reactions were carried out with 300 µM each of pyruvate and H2O2 in DPBS at 37 °C. At the indicated timepoint, pyruvate concentration in the reaction solution was measured using the HPLC method. (A) Data are graphed as pyruvate concentration vs. time and fit with a second-degree polynomial equation (B) Data are graphed as inverse pyruvate concentration vs. time and fit with a linear equation. The slope of the linear line is the rate constant k of the reaction according to Eq. (3). Data were obtained from 6 separate experiments and presented as mean ± SD.

