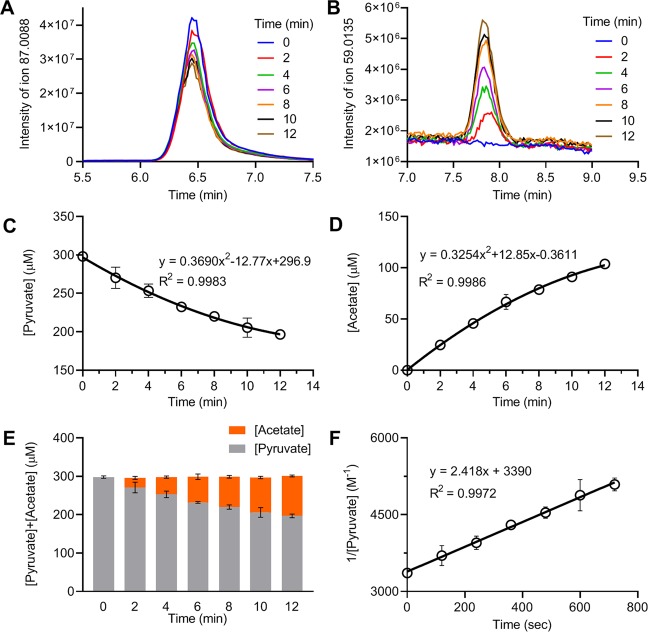
Figure 4.
LC-MS measurement of pyruvate and acetate concentrations. Reactions were carried out with 300 µM each of pyruvate and H2O2 in DPBS at 37 °C. At the indicated time, aliquots of the reaction mixture were removed for LC-MS analysis. (A,B) LC-MS chromatograms showing the detection of pyruvate and acetate, respectively, in the samples at the indicated times. (C,D) Concentrations of pyruvate and acetate, respectively, were calculated according to standard curves, graphed vs. time, and fit to second-degree polynomial equations. (E) Data are graphed as the sum of pyruvate and acetate concentrations vs. time, showing an unchanged total concentration over time. (F) Data are graphed as the inverse concentration of pyruvate vs. time and fit to a linear equation. The slope of the line indicates the k of the reaction. Data were obtained from 3 separate experiments and presented as mean ± SD.

