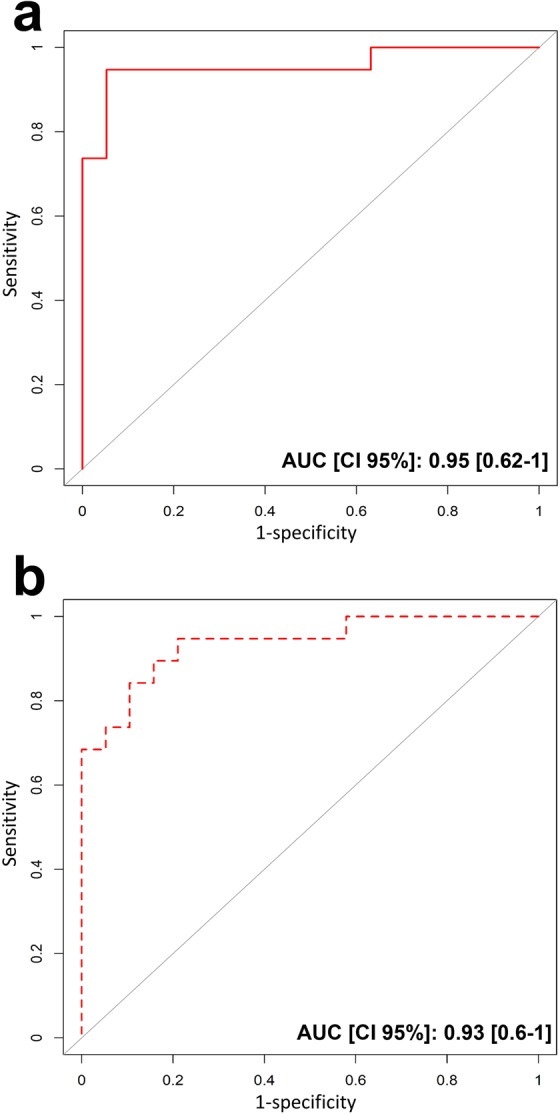
Figure 2.

Receiver operating characteristic (ROC) curve for discriminating STEMI from HD and from SCAD. (a) The area under the ROC curve (AUC) of the capacity of the five identified genes to discriminate STEMI patients and HD (red line). AUC of 0.95 (95% confidence interval 0.62–1.00). (b) The area under the ROC curve (AUC) of the capacity of the five identified genes to discriminate STEMI and SCAD patients (red dotted line). AUC of 0.93 (95% confidence interval 0.60–1.00).
