
Figure 3.
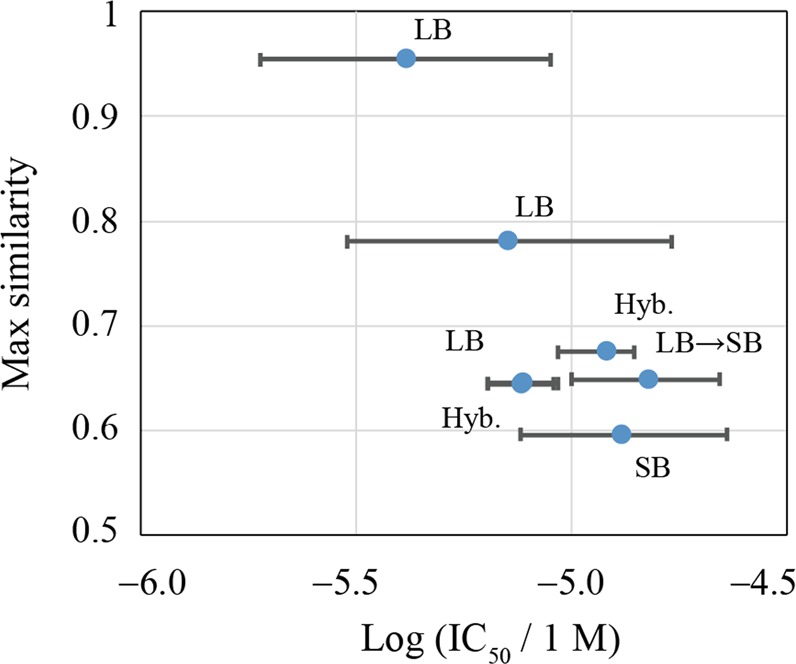
The similarity of each hit compound to known Sirtuin 1 inhibitors (see Novelty of the assayed and hit compounds Section) is plotted against the experimental inhibition activity. The error bar represents 95% confidence intervals estimated from IC50 assays. For each point, the category of method used is presented (see Table 1). The similarity in the figure was calculated with the Tanimoto coefficient of the MACCS descriptor60.