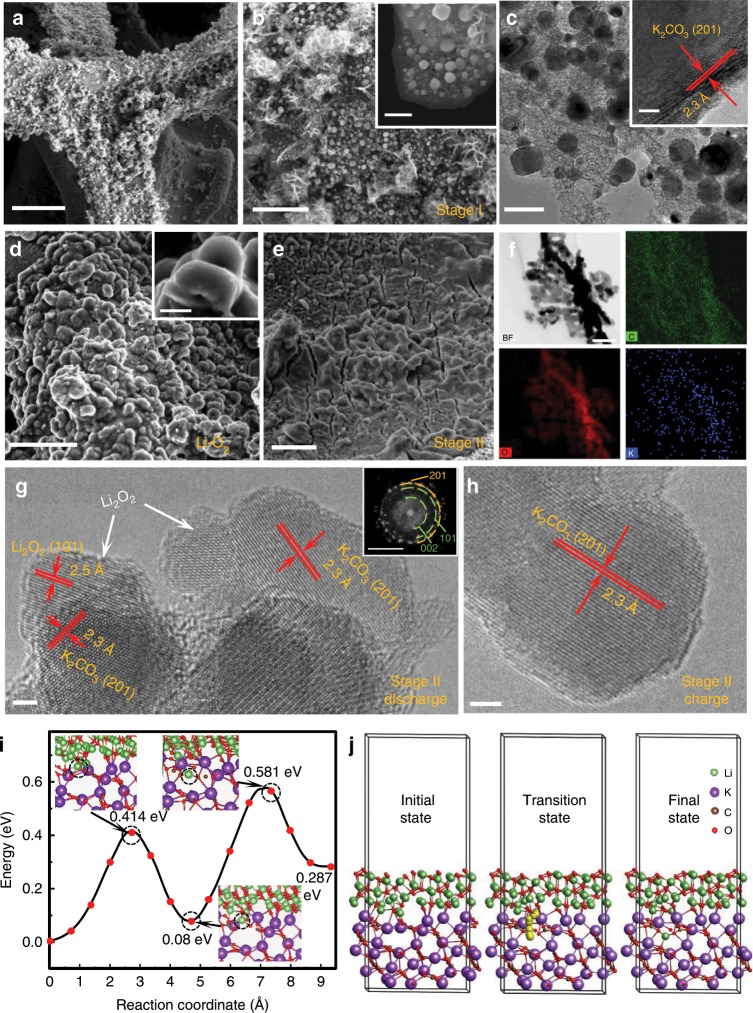
Fig. 4. Heterostructure.
a–c SEM and TEM images of discharged PVP-C@LDO at stage I. Scale bars of a–c are 100 μm, 2 μm and 100 nm, respectively. Scale bars of insets in b, c are 500 nm and 2 nm, respectively. d SEM image of discharged PVP-C@LDO in conventional Li–O2 battery. Scale bar, 5 μm. Scale bar of inset in d is 500 nm. e–g SEM, elemental mapping and HRTEM images of discharged PVP-C@LDO at stage II. h HRTEM image of charged PVP-C@LDO at stage II. Scale bars of e, f, g, and h are 5 μm, 50 nm, 2 nm, and 2 nm, respectively. Inset in g is the corresponding fast Fourier transformed image with scale bar of 5 nm−1 (green: Li2O2; yellow: K2CO3). i Energy barrier profile of Li+ migration through heterojunction of Li2O2 (101)/K2CO3 (201). The migration of Li+ is marked as black dotted circle. j Li+ migration pathways into K vacant site of K2CO3 (201).

