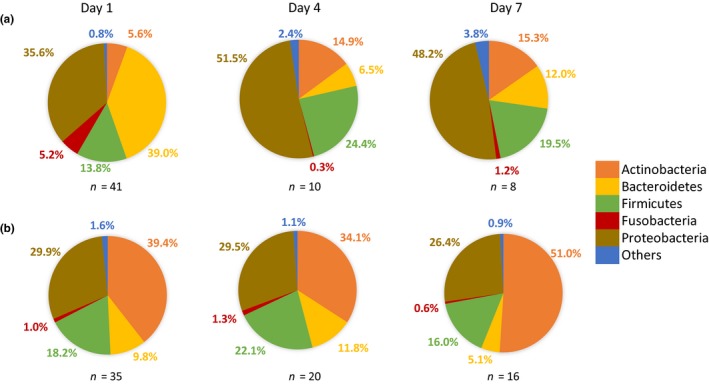
Figure 5.

Distribution of phyla in floral nectar from apple (a) and pear (b) over three sampling points, including start of the flowering period (day 1), peak blooming (day 4), and three days later (day 7). Sequences were attributed to 270, 158, and 210 OTUs in apple nectar and 263, 244, and 205 OTUs in nectar from pear at day 1, day 4, and day 7, respectively. n, number of samples investigated
