Figure A1.

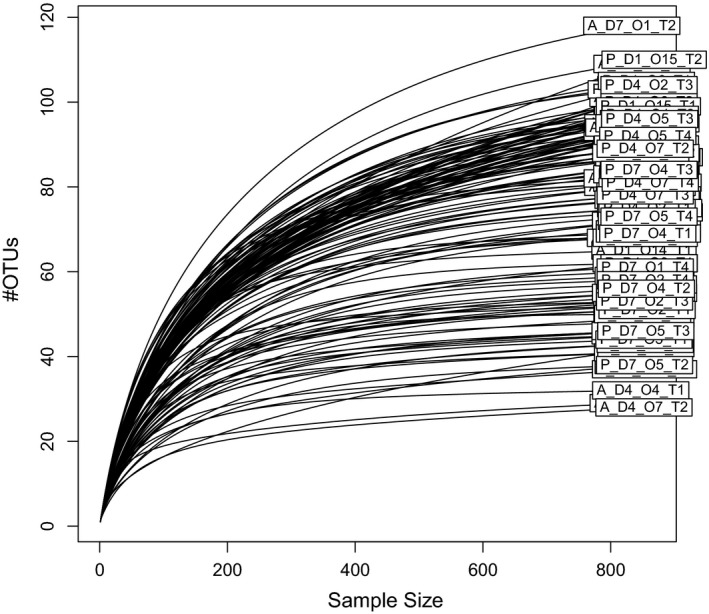
Rarefaction curves showing the number of bacterial operational taxonomic units (OTUs) per sample (A: apple; P: Pear; D: day; O: orchard)

Rarefaction curves showing the number of bacterial operational taxonomic units (OTUs) per sample (A: apple; P: Pear; D: day; O: orchard)