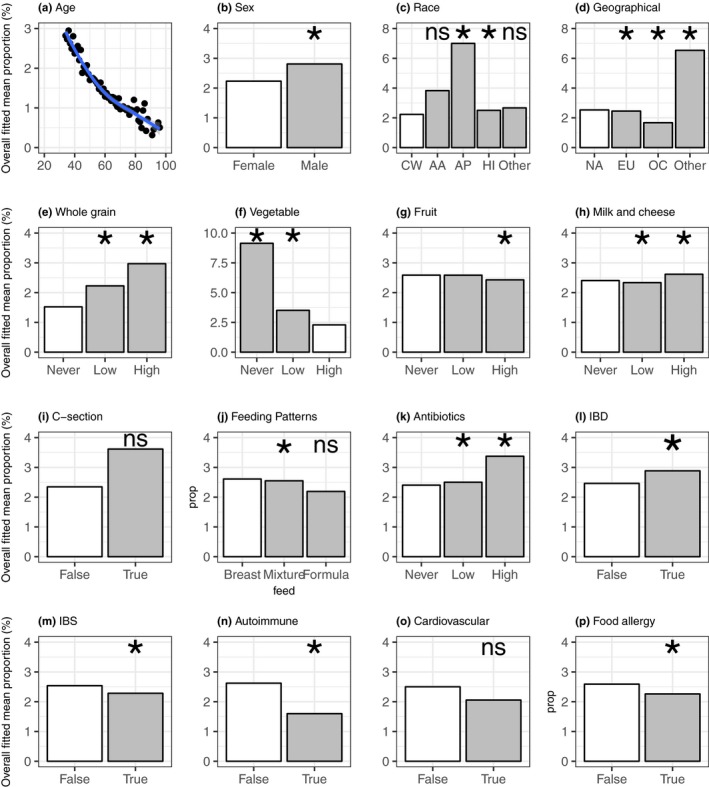
Figure 6.

Predicted relationships between Bifidobacterium abundance and host features based on the ZINB model. The overall fitted mean proportions (%) of Bifidobacterium and age (a); sex (b); race (c); geographical location (d); whole‐grain consumption (e); vegetable consumption (f); fruit consumption (g); milk and cheese consumption (h); C‐section (i); fermented plant consumption (i); feeding patterns (j); antibiotic exposure (k); IBD (l); IBS (m); autoimmune disease (n); cardiovascular disease (o); and food allergy (p). White bar: reference; gray bar: comparisons; race (CW, Caucasian White; AA, African‐American; AP, Asian‐Pacific; and HI, Hispanic); geographical (NA, North America; EU, Europe; and OC, Oceania); *: significance in at least in one part of the ZINB model (p < .05); ns: not significant in two parts of the ZINB model (p > .05)
