Figure A8.

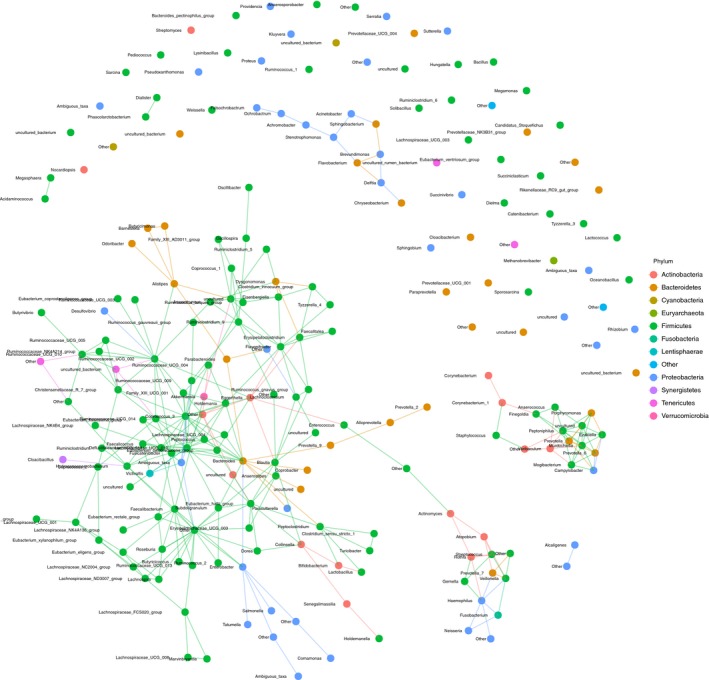
Cooccurrence network of microbial taxa detected in the AGP dataset. The different colors of the nodes represent different phyla

Cooccurrence network of microbial taxa detected in the AGP dataset. The different colors of the nodes represent different phyla