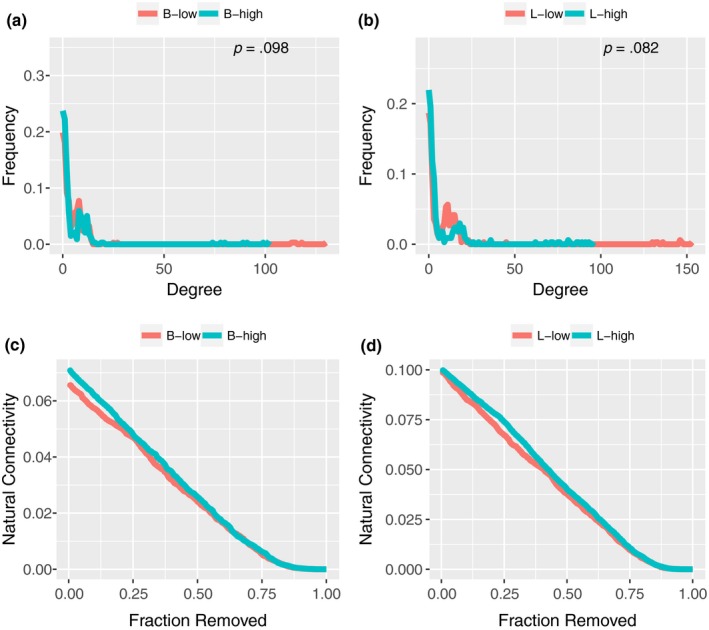
Figure A12.

Degree distribution and natural connectivity. (a) Degree distribution of samples with a higher abundance of Bifidobacterium and samples with a lower abundance of Bifidobacterium. (b) Degree distribution of samples with a higher abundance of Lactobacillus and samples with a lower abundance of Lactobacillus. (c) Node removals were ordered at a random distribution of the natural connectivity for the presence or absence of Bifidobacterium. (d) Node removals were ordered at a random distribution of the natural connectivity for the presence or absence of Lactobacillus. B‐low, lower relative abundance of Bifidobacterium; B‐high, higher relative abundance of Bifidobacterium; L‐Low, lower relative abundance of Lactobacillus; L‐high, higher relative abundance of Lactobacillus
