
Figure 2.
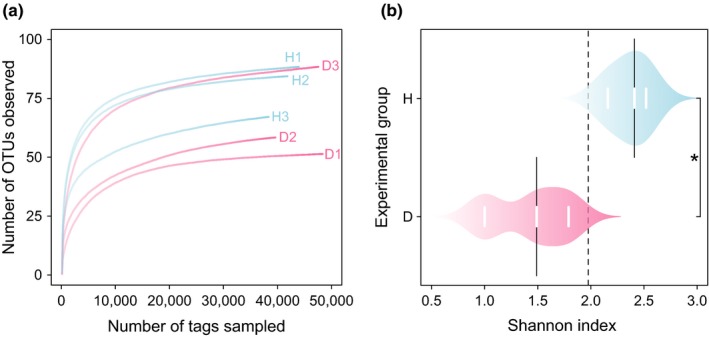
Alpha diversity of the gut microflora of captive Siamese crocodiles. (a) Rarefaction curve sequences show the species richness in the healthy group (H1, H2, and H3) and the diseased group (D1, D2, and D3) at the 3% distance cutoff. (b) The Shannon indexes of the cloacal samples from 6 individual crocodiles. H (n = 3) indicates the healthy group. D (n = 3) indicates the diseased group. * indicates a significant difference between the H group and the D group, as determined by Student's t test. p < .05 was considered significant