
Figure 3.
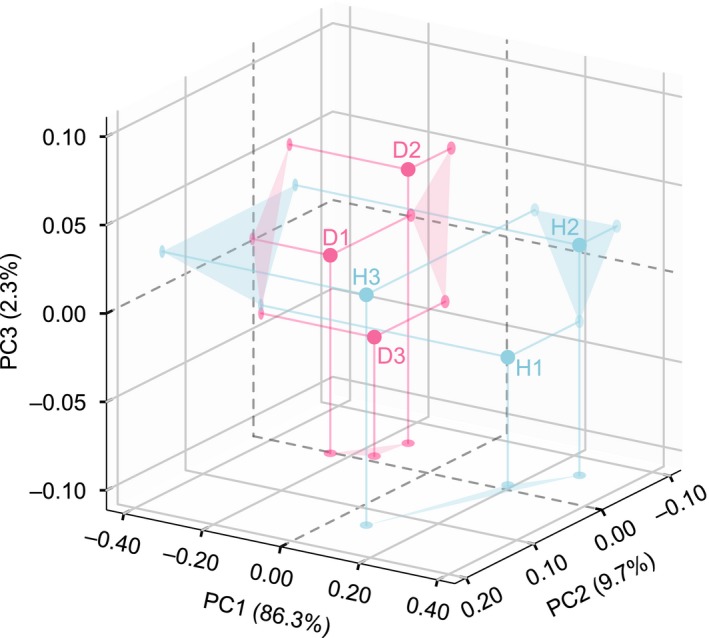
Principal coordinate analysis (PCoA) of differences in gut microbial communities based on the weighted UniFrac distances observed from 6 individual crocodiles. H indicates the healthy crocodile group (containing H1, H2, and H3). D indicates the diseased crocodile group (containing D1, D2, and D3)