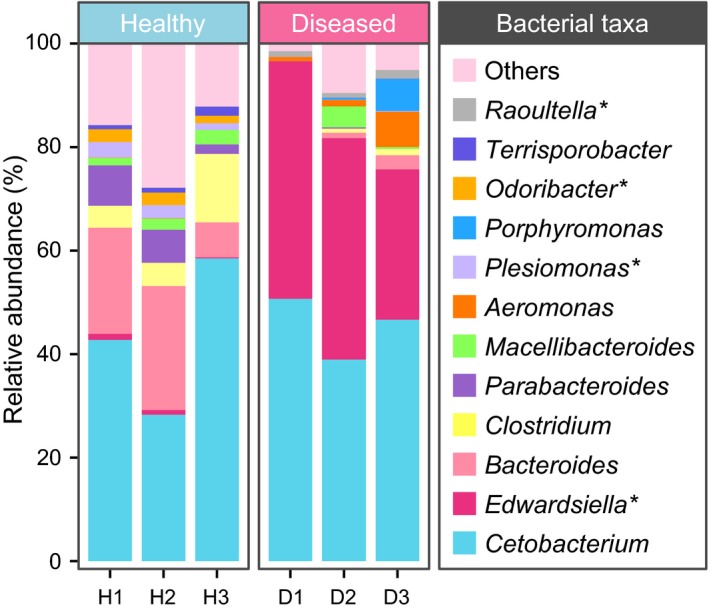
Figure 5.

Relative abundance and composition of gut bacteria from 6 individual crocodiles, organized at the genus level. H1, H2, and H3 indicate the healthy group; D1, D2, and D3 indicate the diseased group. Genera with an observed relative abundance less than 1%, and unclassified bacteria in both groups were assigned as “Others”. * indicates a significant difference between the healthy group and the diseased group, as determined by Student's t test. p < .05 was considered significant
