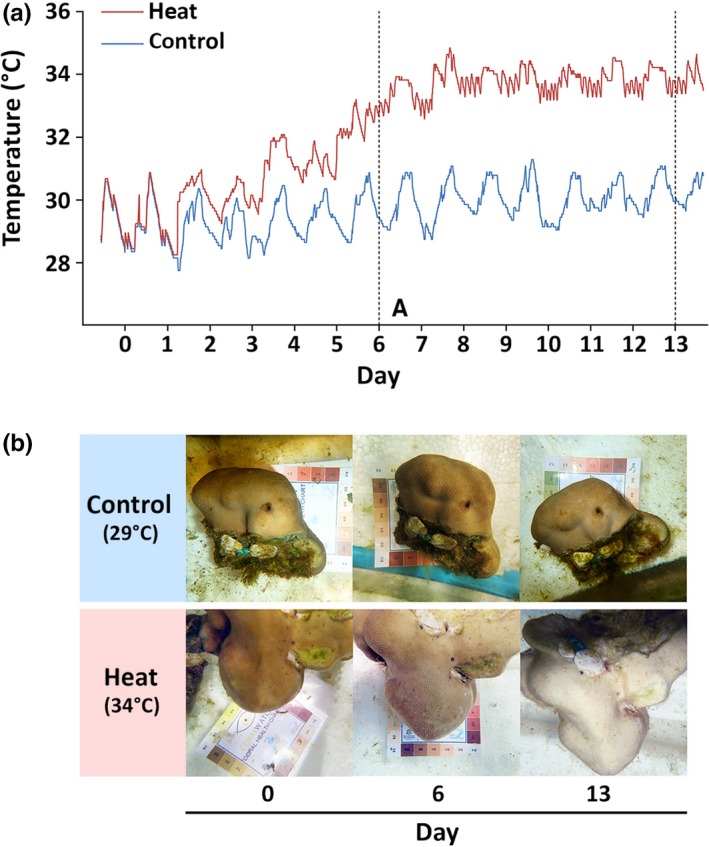
Figure 1.

Temperature logs and physiological response of Porites lutea subjected to a heat treatment. (a) Records of daily water temperatures in control (blue line) and heated (red line) aquaria during the 13‐day experiment. Vertical dotted lines indicate the days on which the samples were collected (day 6 and day 13). (b) Pictures of representative coral fragments from the control (~29°C) and heated (~34°C) aquaria taken prior to (day 0) and following the imposition of short‐term thermal stress (day 6 and day 13)
