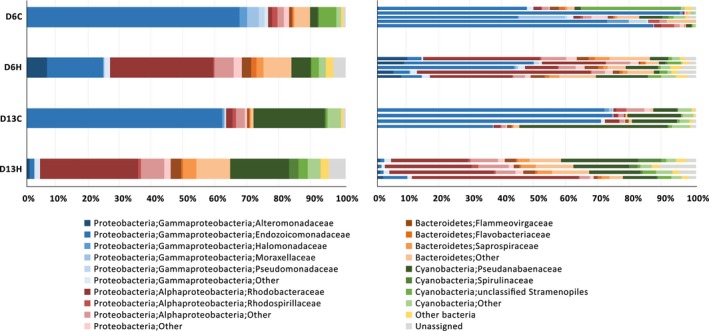
Figure 3.

Dynamics of coral‐associated bacteria during a thermal stress. Bar charts displaying the composition of bacterial communities associated with Porites lutea in control and heated aquaria at a group level (left) and an individual colony level (right). Taxonomic classification of OTUs present in each sample at the phylum/class/family levels was based on the Greengenes database. Eleven most abundant families were depicted, and the remaining taxa were grouped together under “others.”
