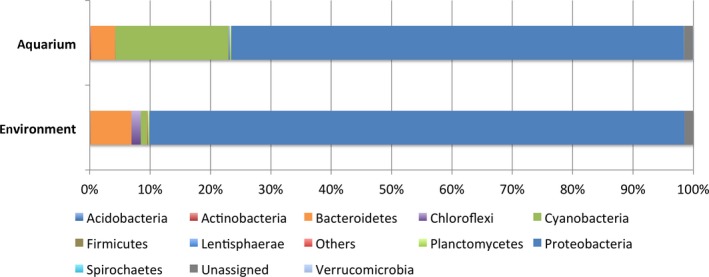
Figure A3.

A bar chart showing the composition of bacterial communities associated with P. lutea in this study (aquarium) and those associated with P. lutea collected directly from the field (environment). Taxonomic classification of OTUs present in each sample at the phylum level was based on the Greengenes database
