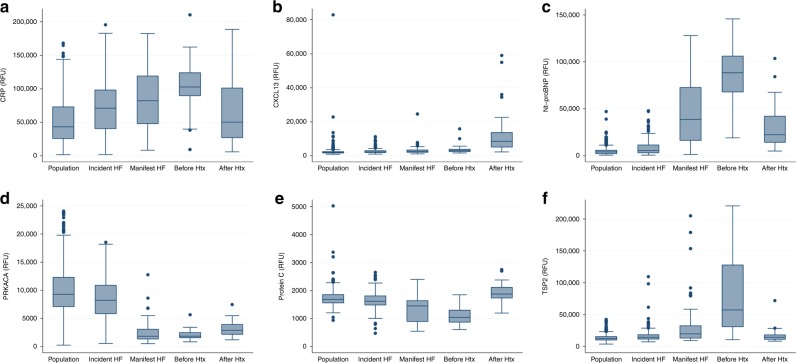
Fig. 2. Plasma protein abundance across heart failure stages.
Box plots depicting distribution of (a) CRP, (b) CXCL13, (c) Nt-proBNP, (d) PRKACA, (e) Protein C, and (f) TSP2 across cohorts representing different stages of heart failure. In addition to association with incident heart failure, these six proteins changed markedly (>50%) after heart transplantation (HTx). Cohorts include individual human subjects from a population-based cohort who did not develop heart failure during follow-up (“Population”, n = 583), from the population-based cohort who did develop heart failure (“Incident HF”, n = 185), subjects with manifest heart failure (“Manifest HF”, n = 84), and serial measures from subjects with advanced heart failure before and after heart transplantation (“Before Htx” and “After Htx”, n = 30 for both). All except CXCL13 changed in directional consistency with the risk estimate for incident HF towards the general population. The box center line indicates the median, box bounds represent 25th and 75th percentiles, and the whiskers are the most extreme values within 1.5× the interquartile range from the nearer quartile. RFU relative fluorescence units.

