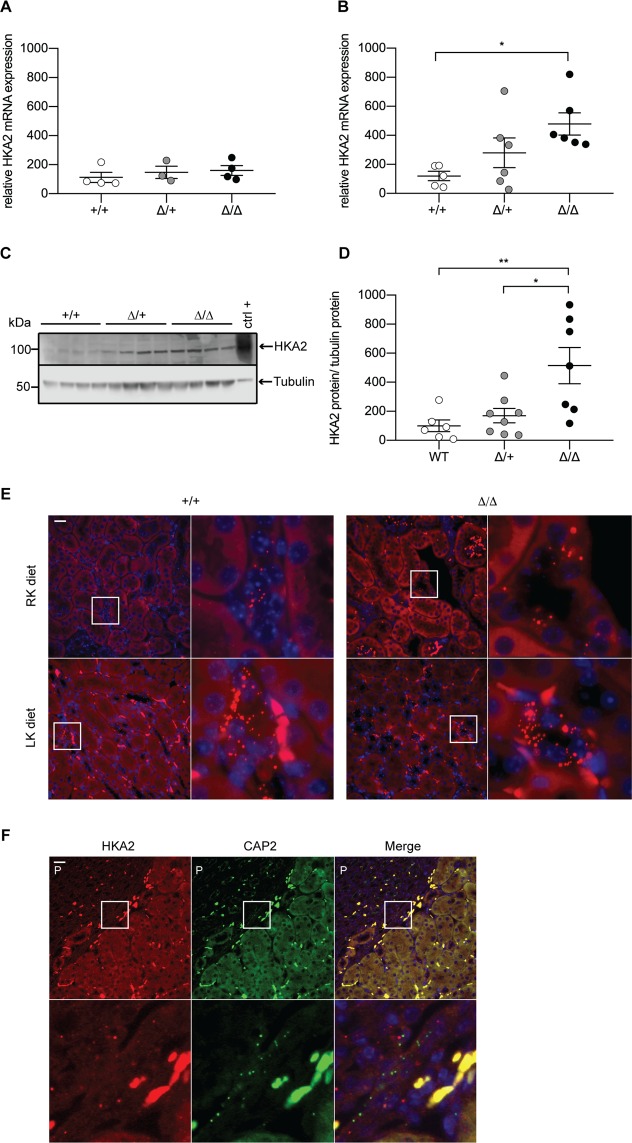
Figure 3.
H+,K+-ATPase type 2 expression is increased in CAP2/Tmprss4 mice on low K+ diet. Relative mRNA transcript expression of H+,K+-ATPase type 2 (HKA2) in CAP2/Tmprss4 wildtype (+/+, white circles), heterozygous mutant (∆/+, grey circles), and knockout (∆/∆, black circles) kidneys under (A) regular K+ diet (n = 5 per genotype), and (B) under low K+ diet (n = 6 per genotype). (C) Representative (cropped) immunoblot for HKA2 in kidney lysates from CAP2/Tmprss4 wildtype (+/+), heterozygous mutant (∆/+), and knockout (∆/∆) mice under low K+ diet (n = 6 per genotype), and (D) corresponding protein quantification. A wildtype colon lysate under regular K+ diet was used as positive control (ctrl+), and tubulin was used as loading control. The membrane was cut and HKA2 and tubulin were blotted separately. (E) RNAscope detection of HKA2 in renal cortex of wildtype and knockout mice under regular K+ diet (RK diet, upper panels) and low K+ diets (LK diet, lower panels). (F) RNAscope co-detection of HKA2 (left panels, red) and CAP2/Tmprss4 (middle panels, green) and merged pictures (right panels) at the cortico-papillary junction under low K+ diet. Magnification 40×, the white boxes indicate zones of higher (63×) magnification, “P” indicates the location of the renal pyramid, scale bar represents 25 µm. *p < 0.05, **p < 0.01. Full-length immunoblots can be found in the supplementary information.

