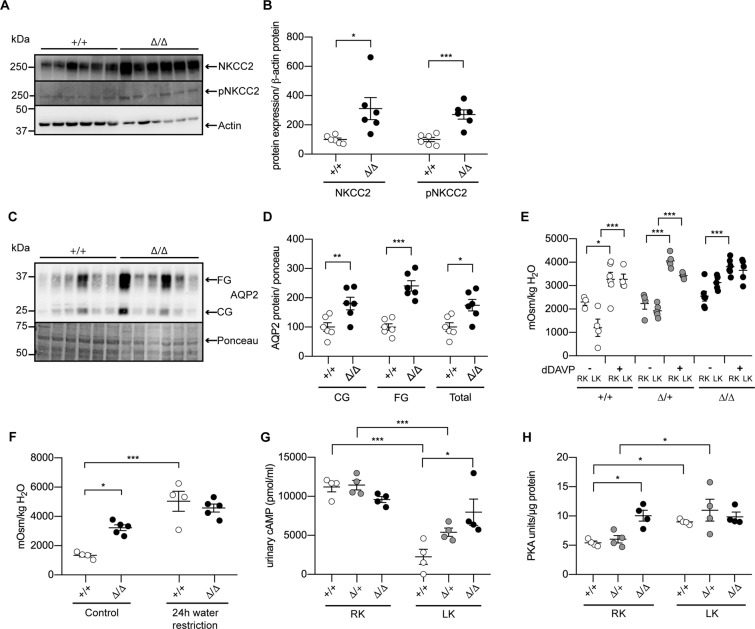
Figure 4.
CAP2/Tmprss4 mice exhibit increased NKCC2 and AQP2 expression and maximal response to dDAVP on low K+ diet independently of vasopressin concentration. (A) Representative (cropped) immunoblot for NKCC2 and pT96/T101-NKCC2 in kidney lysates from CAP2/Tmprss4 wildtype (+/+) and knockout (∆/∆) mice under low K+ diet (n = 6 per genotype), and (B) corresponding protein quantification. (C) Representative (cropped) immunoblot for core (CG) and fully glycosylated (FG), and total (CG + FG) aquaporin 2 (AQP2) and (D) their corresponding protein quantification in kidney lysates from CAP2/Tmprss4 wildtype (+/+) and knockout (∆/∆) mice under low K+ diet (n = 6 per genotype). Actin was used as loading control for NKCC2 and pNKCC2. The membrane was cut, the lower part was blotted against actin, while the upper part was first blotted against pNKCC2 then stripped and then blotted against NKCC2. The ponceau staining was used as loading control for AQP2. (E) Urine osmolality measured before and 5 h after injection of dDAVP in CAP2/Tmprss4 wildtype (+/+, white circles), heterozygous (∆/+, grey circles) and knockout (∆/∆, black circles) under regular K+ diet (RK) and low K+ diet (LK) (n = 6 per genotype and per condition). (F) Urine osmolality before (control) and after 24 h water restriction in CAP2/Tmprss4 wildtype (+/+) and knockout (∆/∆) mice under low K+ diet (n = 6 per genotype and per condition). (G) Urinary cAMP levels in CAP2/Tmprss4 wildtype (+/+, white circles), heterozygous mutant (∆/+, grey circles), and knockout (∆/∆, black circles) under regular K+ diet (RK) and under low K+ diet (LK), and (H) tissue PKA levels of the corresponding mice. *p < 0.05, **p < 0.01, ***p < 0.001. Full-length immunoblots can be found in the supplementary information.

