Figure 7.
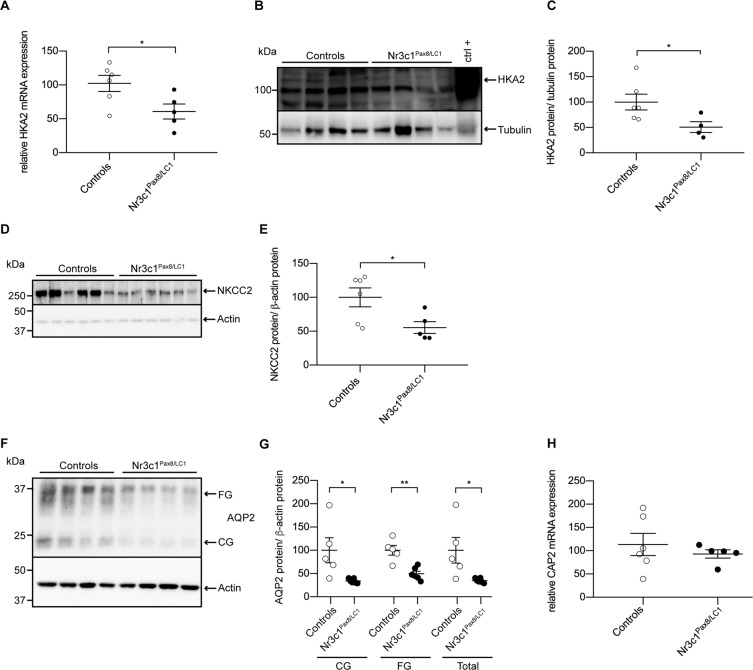
Nephron-specific GR knockout mice display reduced HKA2, NKCC2 and AQP2 protein levels. (A) Relative mRNA transcript expression, (B) representative (cropped) immunoblot and (C) corresponding protein quantification of H+,K+-ATPase type 2 (HKA2) in control (white circles) and Nr3c1Pax8/LC1 (black circles) kidney lysates following low K+ diet (n = 4–6 per genotype). A wildtype colon lysate under regular K+ diet was used as positive control (ctrl+), and tubulin was used as loading control. The membrane was cut and HKA2 and tubulin were blotted separately. (D) Representative (cropped) immunoblot of NKCC2 in control and Nr3c1Pax8/LC1 kidney lysates following low K+ diet (n = 6 per genotype), and (E) corresponding protein quantification. Actin was used as loading control. The membrane was cut and NKCC2 and actin were blotted separately. (F) Representative (cropped) immunoblot and (G) corresponding protein quantification of AQP2 in control and Nr3c1Pax8/LC1 kidney lysates following low K+ diet (n = 4–6 per genotype). Actin was used as loading control. The membrane was first blotted against AQP2, then stripped and blotted against actin. (H) Relative mRNA transcript expression of CAP2/Tmprss4 in kidney of control and Nr3c1Pax8/LC1 mice following low K+ diet (n = 5–6 per genotype). *p < 0.05, **p < 0.01. For the sake of visual clarity, the blot for HKA2 is shown with a higher contrast, quantification was however performed on the original blot. Full-length original immunoblots can be found in the supplementary information.

