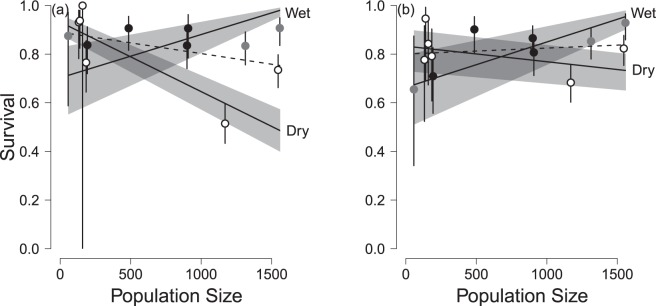
Figure 2.
Survival of (a) male and (b) female Raso larks in relation to population size, according to whether the year was one of the six driest (open circles), three intermediate (grey dots) or four wettest (black dots); bars indicate ± 1 s.e from model ϕsex*PopSize + sex*Rain + sex*PopSize*Rain. The dotted line indicates the response of survival to population size without accounting for rainfall (from model ϕsex*PopSize). Shading indicates 95% confidence limits about the regression.

