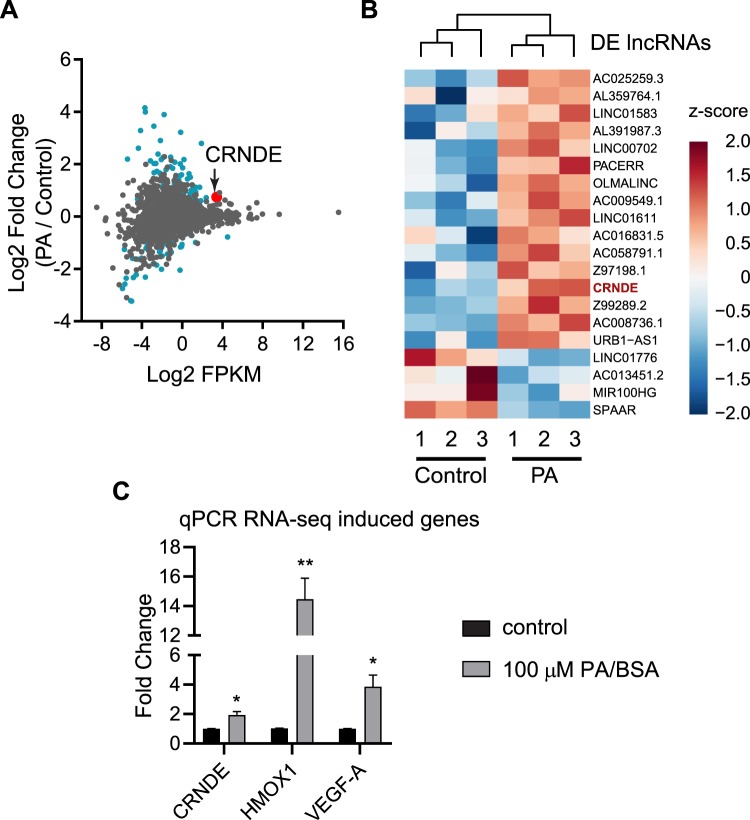
Figure 3.
Differentially expressed lncRNAs. (A) Expression plot of identified lncRNAs. Expression is determined by average FPKM. Blue and red are those lncRNAs significantly differentially expressed; red is CRNDE. (B) Heatmap of the top 20 lncRNAs by expression that are differentially expressed. Data was plotted and ranked as z-score of the log2 fold change. (C) Effect of palmitic acid on gene expression. HUVECs were treated with palmitic acid or vehicle control for 12 hours. The expression of CRNDE, HMOX1, and VEGF-A was analyzed by RT-qPCR, *p < 0.05, **p < 0.001.

