Figure 1.
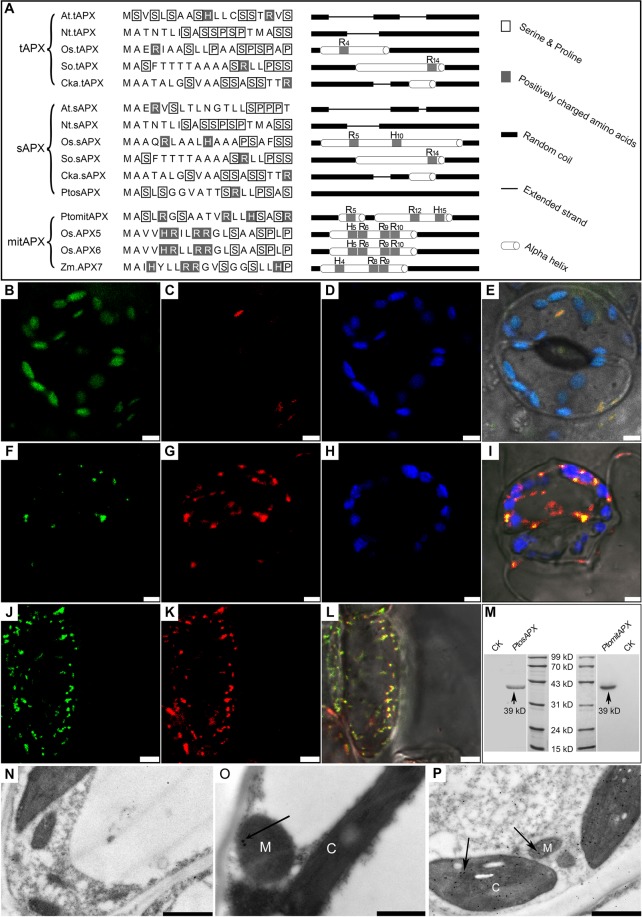
Amino acid sequence and subcellular distribution of PtomtAPX and PtosAPX. (A) Targeting peptide alignment and secondary structure analyses. (B–E) Expression of the PtosAPX-GFP fusion protein in leaf epidermal cells of transgenic tobacco. (B) Fluorescence of PtosAPX-GFP fusion protein. (C) Mitochondria stained with MitoTracker Red. (D) Chloroplast autofluorescence. (E) Merged image. (F–L) Expression of the PtomtAPX-GFP fusion protein in leaf epidermal and root-tip cells of transgenic tobacco. (F,J) Fluorescence of PtomtAPX-GFP fusion protein. (G) and (K) Mitochondria stained with MitoTracker Red. (H) Chloroplast autofluorescence. (I,L) Merged images. Bars, 5 µm. (M) Western blotting analyses of total protein extracts from leaf cells of P. tomentosa using anti-PtomtAPX and anti-PtosAPX antibodies. (N) Negative control. (O) Immunoelectron microscopy of PtomtAPX. (P) Immunoelectron microscopy of PtosAPX. 1 µm (N–P). M, mitochondrion, C, chloroplast.

