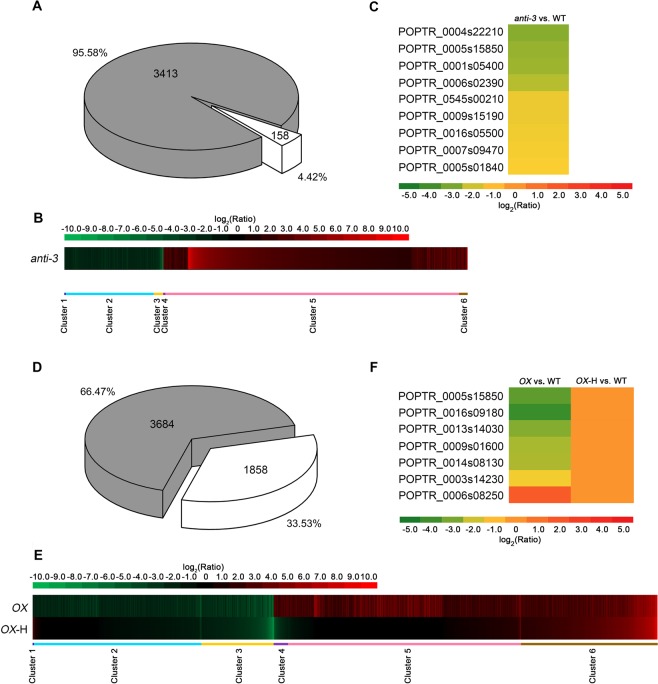
Figure 7.
RNA-seq analyses of anti-3 and OX. (A) DEGs of anti-3 (anti-3 vs. WT) and their expression under AsA treatment (1 mM, 3 h) (corrected P-value < 0.001, fold change >1.5 or < –1.5; gray, genes recovered to normal expression level under AsA treatment). (B) Clustering of expression ratios (anti-3 vs. WT). Red, upregulation; green, downregulation. (C) Heat map of genes related to phenotypes of cells and mitochondria in anti-3, based on the RPKM values. (D) DEGs of OX (OX vs. WT) and their expression under H2O2 treatment (10 mM, 3 h) (corrected P-value < 0.001, fold change >1.5 or <–1.5; gray, genes recovered to normal expression level under H2O2 treatment). (E) Clustering displays of expression ratios (OX vs. WT). Red, upregulation; green, downregulation. (F) Heat map of genes related to phenotypes of cells and mitochondria in OX, based on RPKM values.

