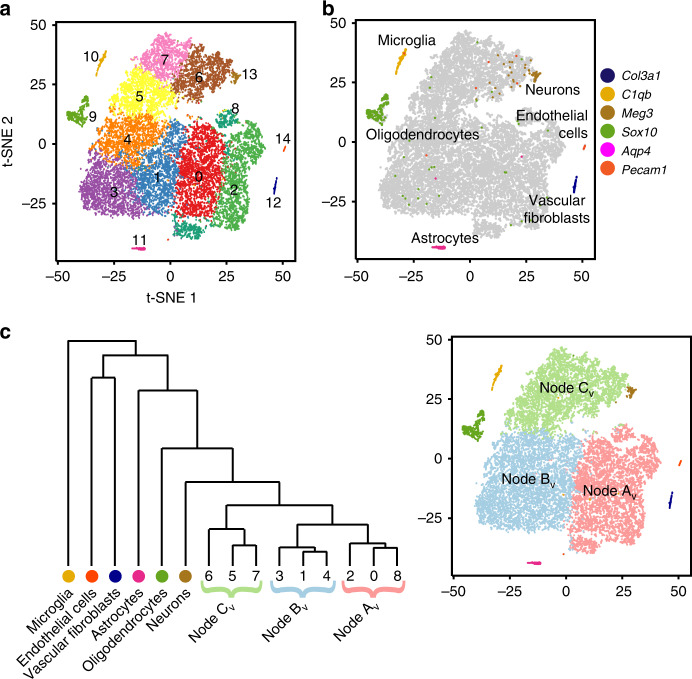
Fig. 2. Single-cell transcriptomic analysis identifies discrete types of cells.
a t-SNE projection of cells from five vehicle-treated tumors, with cells placed according to Euclidean distance from each other in ten-dimensional PCA. The color code indicates clusters. b Feature plot of indicated vascular, microglial and glial markers on the t-SNE projection in a. c Dendrogram showing relationship of Nodes AV–CV defined by HCA and t-SNE projection as in a, color-coded for Nodes and identified cell types. Thresholds for all feature plots are listed in Supplementary Dataset 9.

