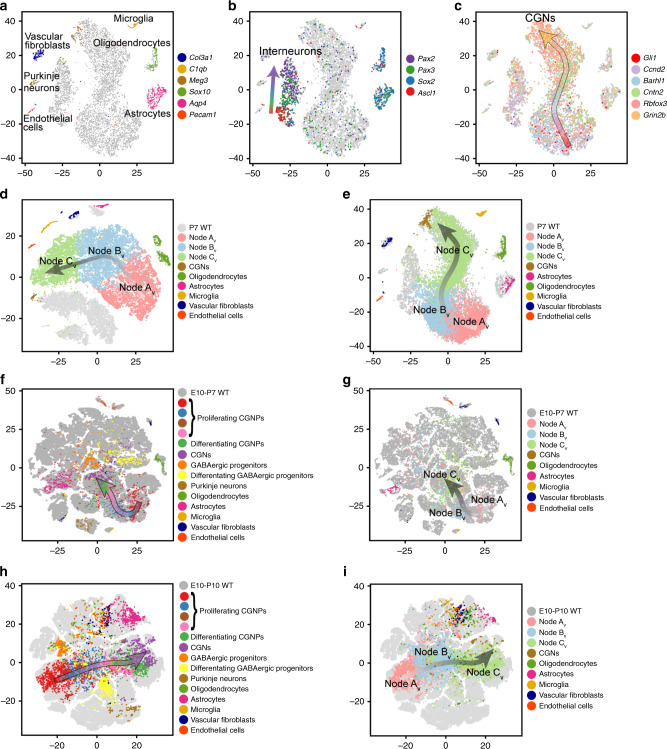
Fig. 3. The tumor cells projected on WT P7 cerebellum predominantly map to CGNPs.
a t-SNE projection of cells from five WT P7 cerebella, based on PCA, color-coded for the expression of indicated vascular, microglial and glial markers. b Feature plot of Pax2, Sox2, Pax3, Ascl1 on the t-SNE projection in a. c Feature plot of CGNP markers Gli1, Ccnd2, Barhl1, Cntn2, Rbfox3, Grin2b on the t-SNE projection in a. d Seurat CCA analysis of M-Smo and WT cells with co-clustering of stromal cell types and no co-clustering of Nodes AV–CV. e Cells from the five vehicle-treated M-Smo tumors, mapped using the k-NN algorithm onto the WT P7 cerebella t-SNE projection in a, with Nodes AV–CV and identified cell types color coded. f, h P7 WT cells mapped by kNN onto the t-SNE of WT cells from f Vladoiu et al.34 or h Carter et al.34. g, i Vehicle-treated M-Smo cells mapped by kNN onto the t-SNE of WT cells from g Vladoiu et al.34 or i Carter et al.34. On t-SNE plots with multiple markers, individual cells may express more than one marker and markers are over-plotted in the order listed. Individual markers may be separately plotted at http://gershon-lab.med.unc.edu/single-cell/.

