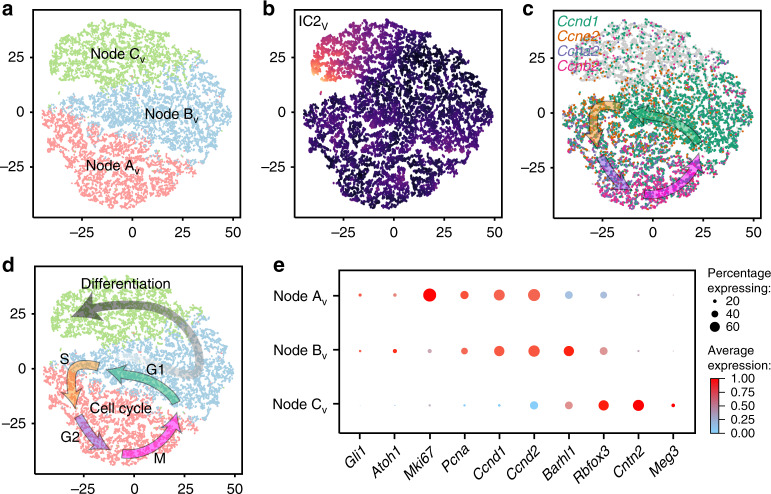
Fig. 4. ICA on CGNP-like tumor cells demonstrates self-renewal and differentiation.
a t-SNE projection of CGNP-like cells from vehicle-treated tumors directed by ICA, with Nodes AV–CV color-coded. b ICA t-SNE as in a, with IC2V color-coded from yellow (high) to blue (low). c Feature plot of Ccnd1, e2, a2 and b2 on ICA t-SNE in a. Arrows are placed according to indicated marker expression and show the expected sequence of Cyclins through the cell cycle. d Pseudotime trajectories inferred by IC2V and Cyclin expression, plotted on ICA t-SNE in a. e Dot Plot showing expression of developmental markers across Nodes AV–CV. Average expression values are calculated from all cells in each Node, including cells with no detectable copies of the transcript.

