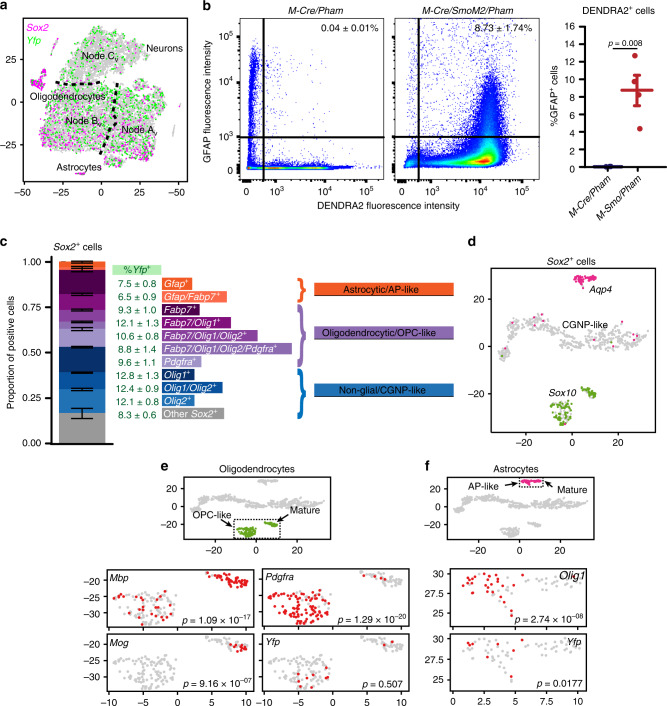
Fig. 5. Tumors show lineage expansion and stem cell marker expression.
a Feature plot of Sox2 and Yfp on the t-SNE projection of Fig. 2a. b Representative flow cytometry studies, plotting GFAP expression of each cell versus DENDRA2 expression, with thresholds for positivity indicated by solid lines, and with the fraction of GFAP+ cells in the DENDRA2+ cerebellar or tumor populations of replicate mice of indicated genotypes. c Bar plot showing the proportions of Sox2+ cells expressing indicated markers in each of the five vehicle-treated tumors. Error bars are SEM. d t-SNE projection of Sox2+ cells from the five vehicle-treated tumors, directed by ICA, with feature plots of Sox10 and Aqp4. e Oligodendrocytic clusters of the t-SNE projection in d, with feature plots of Pdgfra, Mbp1, Plp1, Mog and Yfp. f Astrocytic clusters of the t-SNE projection in d, with feature plots of Olig1 and Yfp. p Value in b determined by two-sided Student’s t-test and in e and f, by Fisher’s exact test.

