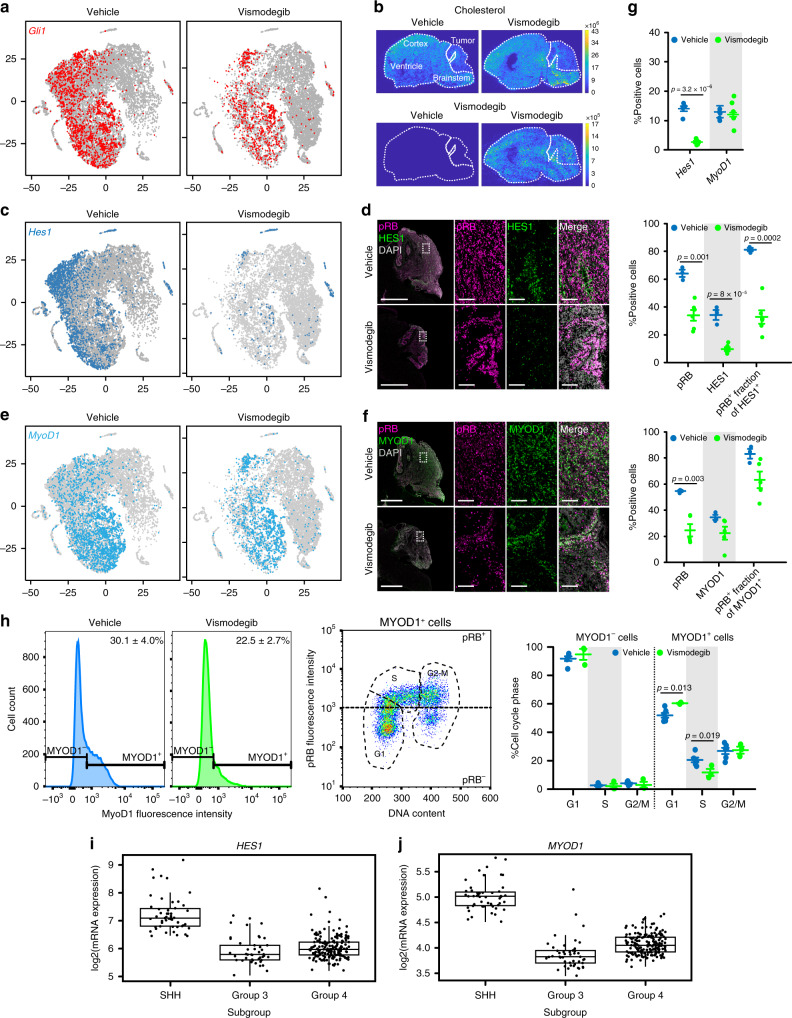
Fig. 7. HES1 and MYOD1 mark vismodegib-responsive and resistant subsets of cells.
a t-SNE projections as in Fig. 6a, with Gli1+ cells indicated. b MALDESI images of cholesterol and vismodegib distribution in sagittal brain sections including both tumor and normal brain. c t-SNE projections as in a with Hes1+ cells indicated. d IHC for HES1 and pRB in sagittal hindbrain sections from representative M-Smo mice treated as indicated. e t-SNE projections as in a, with Myod1+ cells indicated. f IHC for MYOD1 and pRB in sagittal hindbrain sections from representative M-Smo mice treated as indicated. g Quantification of data from c–f. Dots represent individual replicate mice. Horizontal lines represent means and error bars indicate SEM. h Analysis of MYOD1, pRB and cell cycle phase by flow cytometry. Graphs formatted as in g. i, j Expression microarray data on HES1 and MYOD1 expression in human medulloblastoma samples, as presented in ref. 44, with boxes indicating the mean, 25th and 75th percentile and whiskers indicating the 10th and 90th percentiles. Scale bars = 2 mm, except in insets where scale bars = 100 µm. p Values determined by two-sided Student’s t-test.

