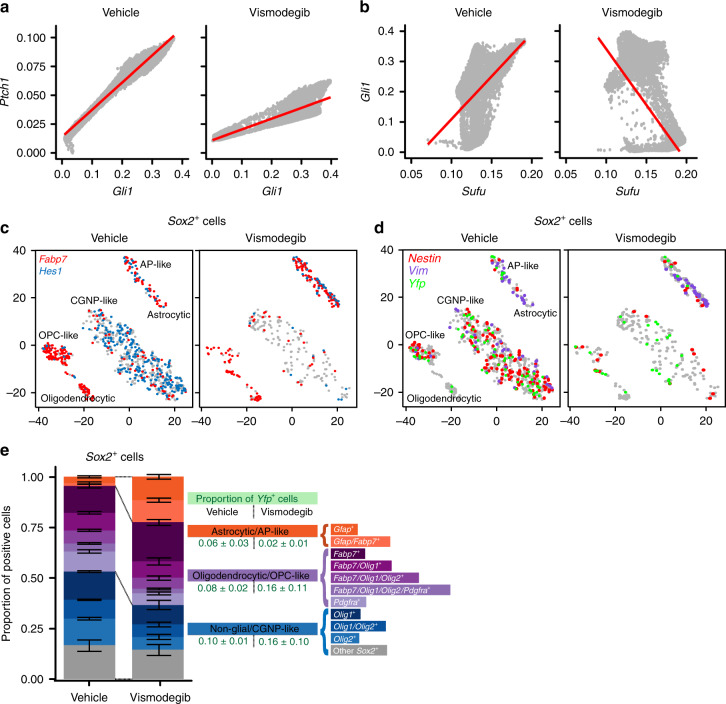
Fig. 8. Factors that maintain proliferative and stem-like phenotypes after vismodegib.
a Correlation plot after imputation of data, showing expression of Gli1 on the X-axis and Ptch1 on the Y-axis, in vehicle- and vismodegib-treated tumors graphed separately. Each dot represents an individual cell. b Correlation plot after imputation of data, showing expression of Sufu on the X-axis and Gli1 on the Y-axis, in vehicle and vismodegib-treated tumors graphed separately as in a. c t-SNE projection of Sox2+ cells from vehicle-treated and vismodegib-treated tumors, directed by ICA with expression of Fabp7 and Hes1 color coded. d t-SNE projection of Sox2+ cells from the five vehicle-treated and five vismodegib-treated tumors, directed by ICA, with expression of Nes, Vim and Yfp indicated. e Bar plots comparing the proportions of Sox2+ cells expressing indicated markers in each of the five vehicle-treated or vismodegib-treated tumors. Error bars are SEM. The Yfp+ fractions are indicated.

