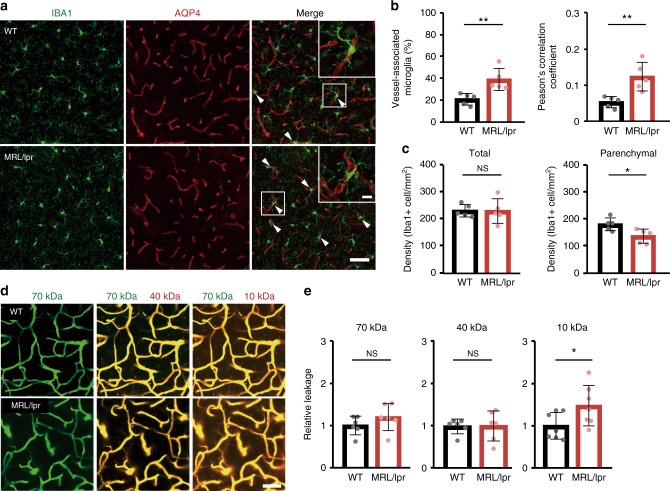
Fig. 1. Systemic inflammation is associated with a leaky BBB and a close association between microglia and cerebral blood vessels.
a Fluorescent images of IBA1 (microglia, green) and AQP4 (astrocyte end-feet marker, red) in WT mice and in mice with chronic systemic inflammation (MRL/lpr mice). Upper right boxes in right panels show magnified images of a typical blood vessel with associated microglia. Scale bar, 50 and 10 μm for magnified image. Arrowheads indicate a contact between microglia and blood vessels. b The proportion of microglia in contact with blood vessels and the extent of overlap of IBA1 and AQP4 fluorescence as quantified by a Pearson’s correlation coefficient were both higher in MRL/lpr mice than in WT mice. c The density of parenchymal microglia (right panel) is decreased in MRL/lpr mice, whereas the total density of microglia in the whole field of view (left panel) is the same in WT and MRL/lpr mice. d, e BBB permeability was quantified from the leaking of different molecular size (10, 40, 70 kDa) dextran-conjugated fluorophores into the parenchymal space outside the vessels, with each dextran fluorescing at a different color (and pseudo-colored here as green or red). Vessels were identified by the impermeant 70 kDa fluorophore (green), while leak identified by leakage (red) of fluorescence outside the co-labeled (yellow) vessels. Representative images (left) indicate that blood vessels in WT mice were impermeant to all these fluorophores and only the blood vessels themselves fluoresce (upper panels). Vessels in MRL/lpr mice are permeant to the 10 kDa dextran, which is visible in the parenchymal space adjacent to, and outside, the vessels (lower panels). Relative leakage is quantified by comparing mean parenchymal fluorescence intensity in MRL/lpr mice with that in WT mice (normalized to 1.0). In MRL/lpr mice, vessels leak only the smaller 10 kDa dextran. Scale bars in d, 50 μm. Graphs show data from an individual animal (b, c, e), overlaid with mean ± SD. NS not significant. *P < 0.05 and **P < 0.01.

