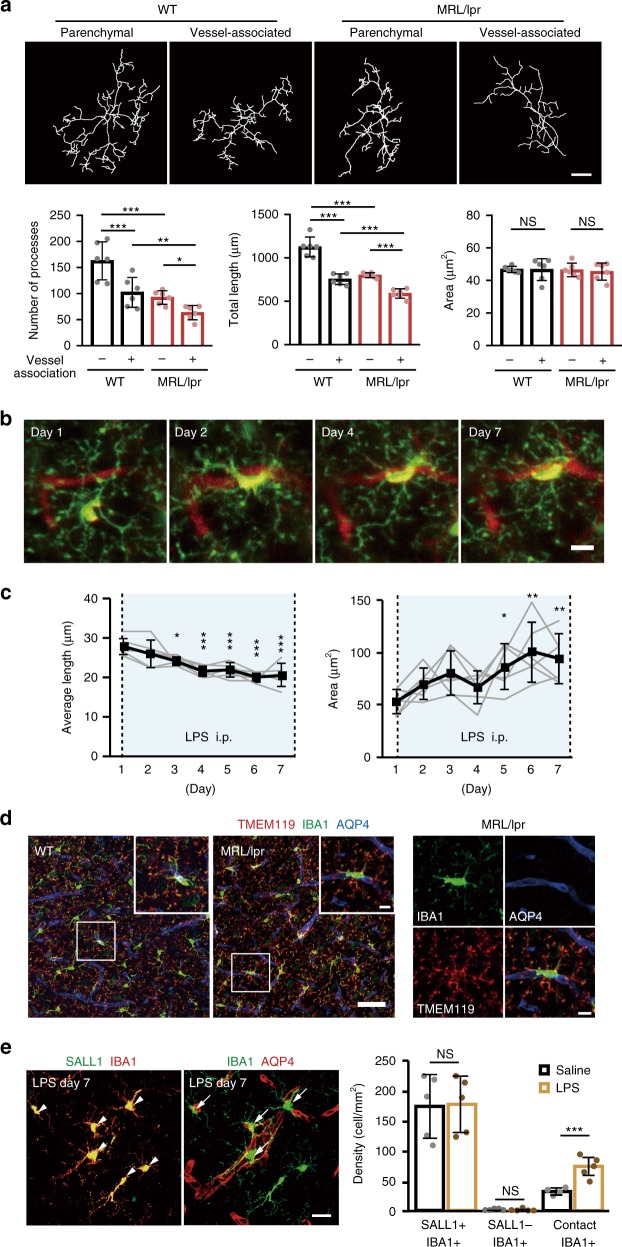
Fig. 3. Changes in microglia morphology and dynamics during systemic inflammation.
a Different properties of microglia process in vessel-associated and parenchymal microglia in MRL/lpr mice. Upper panels show topological skeletonized images of microglia from WT (left) and MRL/lpr mice (right) in parenchyma or associated with vessels. Microglia were visualized by IBA1 immunostaining and the processes were traced by ImageJ. Scale bar, 10 μm. Bottom panels quantify the number of process (left panel) and the mean cumulative length (center panel) of microglia processes in each mouse and the mean area of the cell soma. b A series of typical images from a mouse during LPS injections showed microglial (green) migration to a vessel (red) and the associated changes in microglia morphology. Scale bar, 10 μm. c Quantitative analysis of the mean length of microglial processes (left panel) and the mean microglial soma area (right panel) during 7 days of LPS injections. d Typical images of microglia stained positive for both IBA1 and TMEM119 in WT (left) and in MRL/lpr (middle) mice. Boxes at the top right show magnified images of the region indicated in the main panel. The right-hand panel shows the individual fluorescent channels (and merged channel) for the magnified image from the MRL/lpr mouse. e Typical images of microglia positive for both IBA1 and SALL1 (left) or IBA1 and AQP4 (right) after 7 days of LPS injections to quantify the progeny of vessel-associated microglia. The right panel shows mean data for the density of cells identified by IBA1 or SALL1. The total number of resident brain microglia counts (SALL1+’ve) or infiltrating macrophages/microglia (SALL1−’ve, IBA1+’ve) were not altered by LPS, while the number of resident microglia associated with vessels (contact IBA1+’ve, colocalized with AQP4) was increased by LPS. Scale bar, 20 μm. In all graphs, each point indicates data from an individual animal (a, c, e), while columns and error bars show mean ± SD. NS not significant. *P < 0.05, **P < 0.01, and ***P < 0.001.

