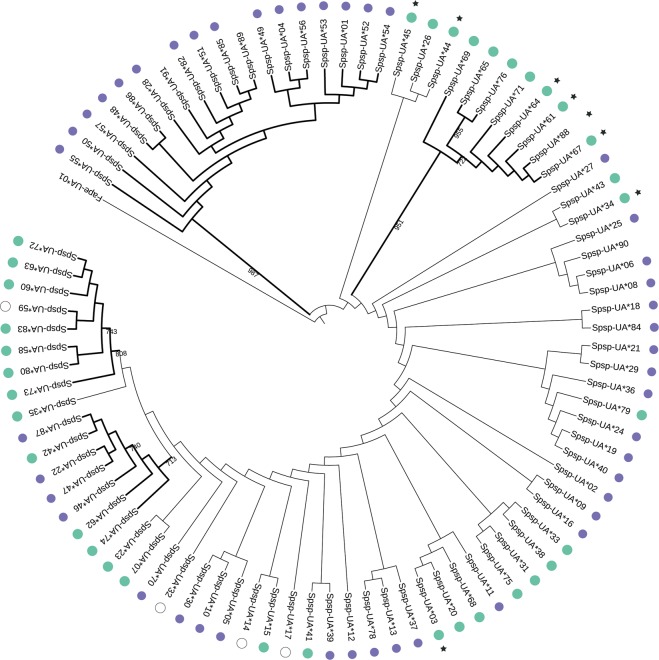
Figure 2.
Maximum likelihood tree based on 88 MHC class I exon 3 nucleotide sequences from siskins. One MHC class I sequence (GenBank acc. nr. JN613264) from Falco peregrinus was used as the outgroup. The tree was constructed with PhyML software (version 3.1.2) using the K80 model with gamma distribution and 1000 bootstraps, displaying bootstraps values higher than 700. Four clusters had high bootstrap support which are indicated with bold lines. Green circles represent alleles with high expression, purple circles represent alleles with low expression, white circles represent alleles with undetermined expression and alleles without circles are not expressed. Stars (*) indicates alleles that had a 3 bp insertion. Branch length is unscaled, i.e. all branches are the same length. All non-classical alleles (N = 18) are found in one cluster with strong bootstrap support (987).

