Figure 1.
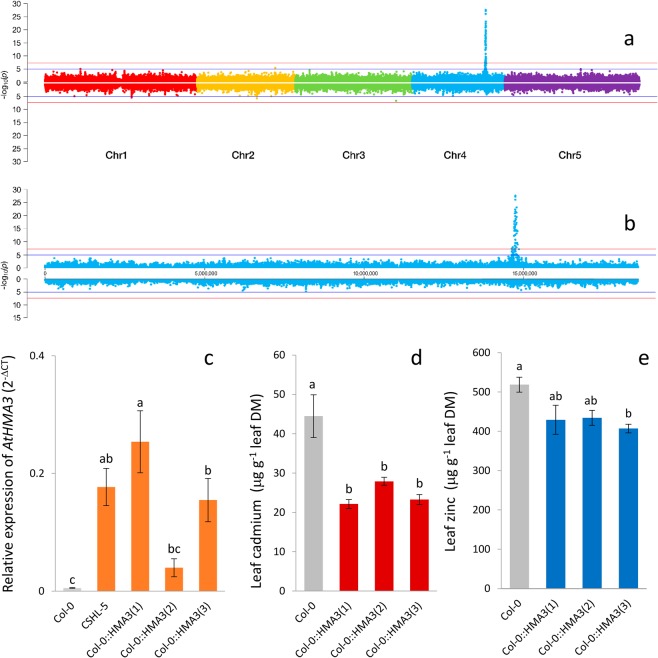
Genome-wide association mapping of leaf cadmium (top) and zinc (bottom) of 206,088 SNPs across 340 A. thaliana accessions using a mixed model analysis. Horizontal blue line indicates suggestive significance (-log10(1e-5)), horizontal red line indicates genome-wide significance (−log10(1e-7.5)) (a). Chromosome 4 detail (b). Relative expression of AtHMA3 in roots of A. thaliana Col-0, CSHL-5 and Col-0::HMA3CSHL−5 lines. PEX4 and EF1-α4 were used as internal normalization standard across all samples and HMA3 expression levels were calculated by 2−ΔCT method52 (c). Concentration of cadmium (d) and zinc (e) in leaves. Bars correspond to the means of biological replicates and the error bars correspond to the standard error. Letters above bars indicate statistically significant differences using a one-way ANOVA with Tukey’s test using a 95% confidence interval.

