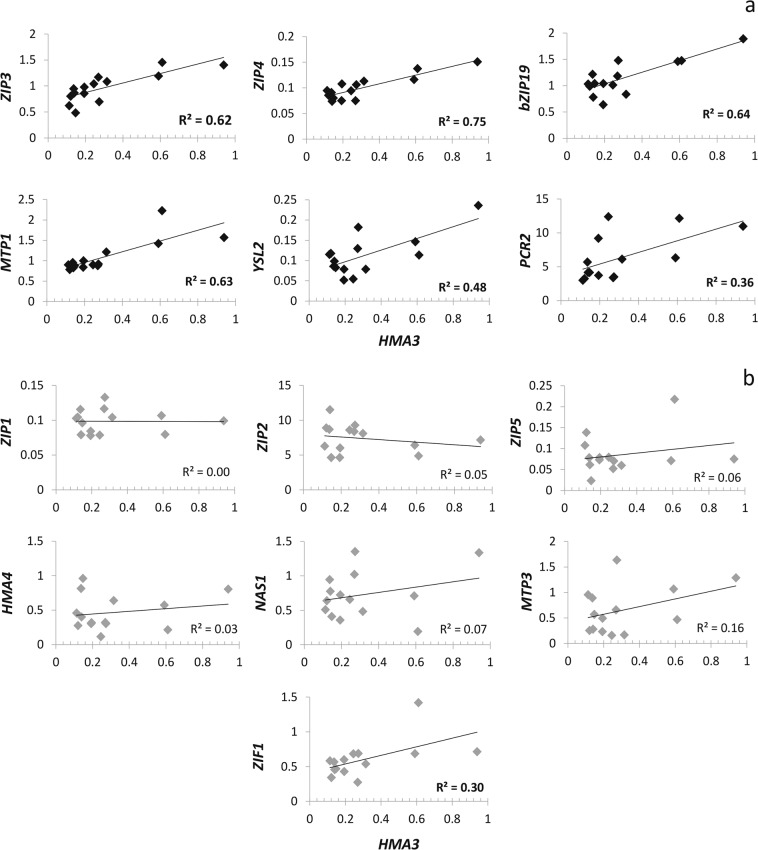
Figure 2.
Correlation between root relative expression of AtHMA3 and Zn-related genes in transgenic lines. PEX4 and EF1-α4 were used as internal normalization standard across all samples and the expression levels were calculated by 2−ΔCT method52. The points in Fig. 2 refer to individual plants from the three complementation lines used in this work. Significant correlations (*P ≤ 0.05; **P ≤ 0.01; ***P ≤ 0.001) are shown as black diamonds (a) and non-significant correlations are shown as grey diamonds (b).

