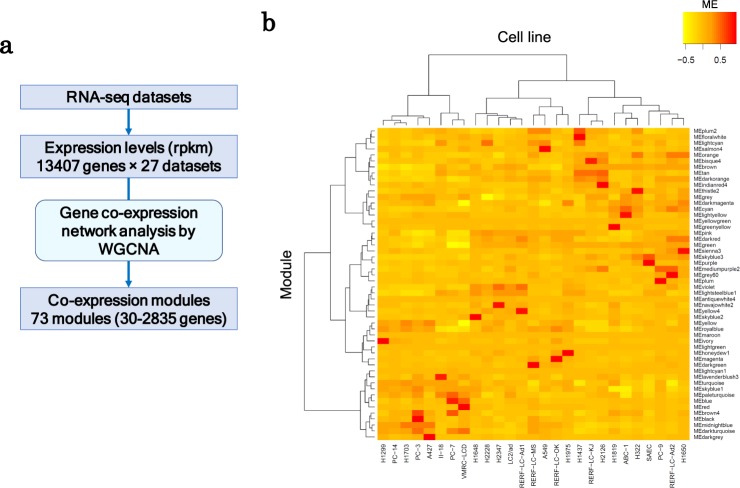
Figure 3.
Transcriptional trends of lung adenocarcinoma based on gene co-expression networks. (a) A simple workflow of the WGCNA analysis. (b) The heat map of the module activities in the lung cancer cell lines. The eigengenes of the modules are represented as the module activities. The hierarchical clustering was conducted using Ward’s method with Pearson correlation. For the selected modules, the clustering analysis is provided in Fig. 6a.

