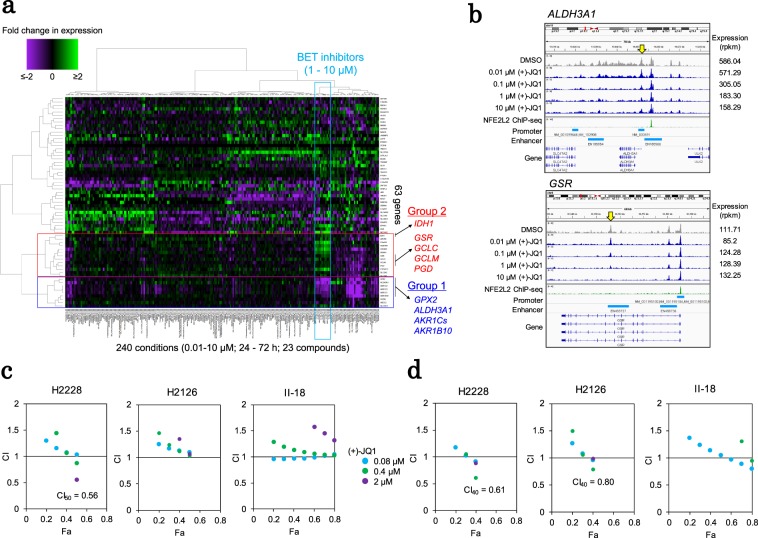
Figure 5.
Epigenetically targeted inhibitors affect the KEAP1-NFE2L2-centered modules. (a) Transcriptome perturbation of the “lightcyan (putative redox)” module in A549 cells. Fold changes in expression associated with drug treatment (dataset-1) are shown for 63 core “lightcyan” module genes in the heat map. The color key is shown in the margin. The genes downregulated (group 1) or upregulated (group 2) by BET inhibitors are shown and are framed in red and blue, respectively. (b) Epigenomic perturbation by (+)-JQ1 treatment. The ATAC-seq patterns of ALDH3A1 (upper) and GSR (lower) were visualized using IGV (autoscale). Yellow arrows indicate the ATAC peaks with dose-dependent changes. (c) The combination indexes (CI) for dual stimulation with auranofin and (+)-JQ1 in the H2228, H2126 and II-18 cell lines. The CI-Fa (fraction affected) plot is shown. The method used for CI calculation is described in the Methods section and in Supplementary Fig. S11. The color legend is shown in the margin. (d) The CI-Fa plots of dual stimulation with (+)-JQ1 and vorinostat. The color legend is shown in c.

