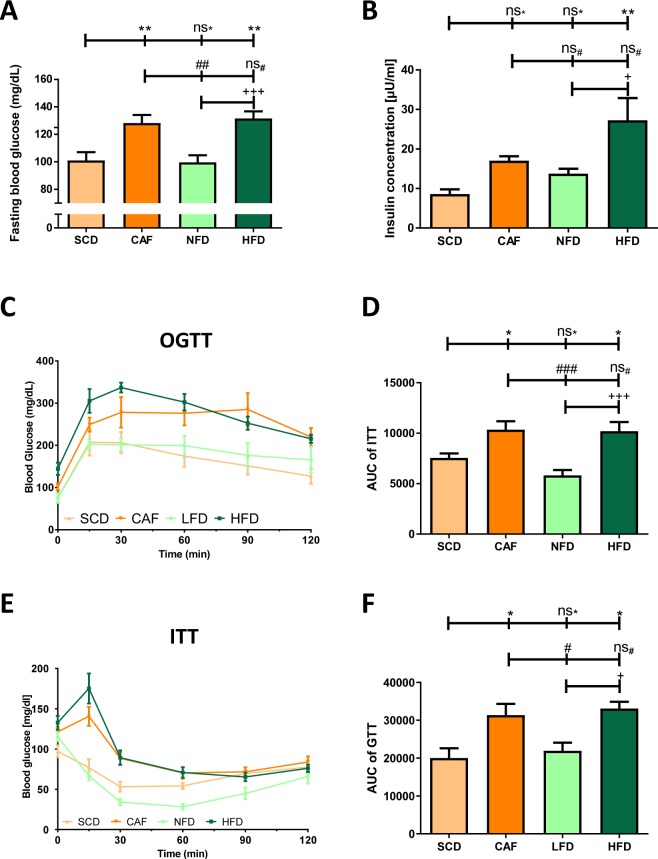
Figure 3.
Glucose intolerance. Male C57BL/6J mice were put on experimental diets at the age of 6 weeks for another 12 weeks. Panel A shows the fasting glucose levels in the 12th week of feeding. n = 15 (SCD and CAF) or 20 (NFD and HFD), respectively. Panel B shows the plasma insulin concentration in the 12th week of feeding. n = 6 (SCD, NFD and HFD) or 5 (CAF), respectively. Panel C shows the results of GTT at the end of the experiment after overnight fasting. n = 5 (SCD, CAF and HFD) and 9 (NFD), respectively. Panels E shows the results of ITT (1 IU/kg body weight insulin was injected intraperitoneally) in the 12th week of experimental feeding after overnight fasting. n = 10 (SCD and NFD) and 9 (CAF and HFD), respectively. The area under the curve (AUC) of GTT and ITT are shown in panels D and F, respectively. Significances marked with *,# and +refer to comparisons to the SCD, CAF and NFD group, respectively. *,#,+P < 0.05, **,##P < 0.01, ***,###,+++P < 0.001, ns, not significant.

