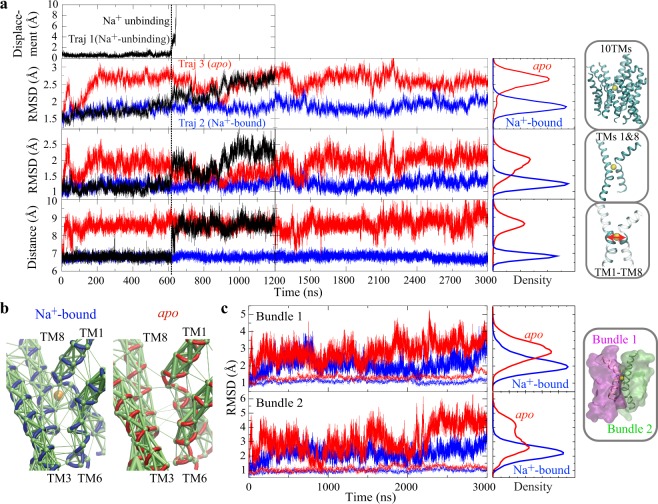
Figure 2.
Na+-binding conformational effect in the OF state of Mhp1. (a) Dynamics and conformational changes for OF apo and Na+-bound forms. The displacement of Na+ ion from its binding site in Traj.1 is shown in the top panel. The second and third panels respectively depict the time series of the backbone RMSD of the 10 TMs or TMs 1 and 8 of the protein during three simulations (Traj.1: black, Traj.2: blue, Traj.3: red). The fourth panel shows the distance between TM1 and TM8 as the distance between the centers of masses of backbone atoms of residues 38 to 41 (TM1) and residues 309 to 313 (TM8). The vertical black dashed line marks the snapshot when Na+ unbound in Traj.1, and the vertical black solid line marks the end of Traj.1. (b) Dynamical network analysis for Na+-bound (left) and apo (right) states, derived from Traj.2 and Traj.3 to describe the residue-residue dynamical correlation65. Allosteric interactions within the network are shown as green edges weighted by correlation data. (c) Na+ locks the relative motion between the two helical bundles. Backbone RMSD of Bundle 1 (top) and Bundle 2 (bottom), either with the other bundle aligned (solid line) or with the same bundle aligned (dotted line), for apo (red) and Na+-bound (blue) forms.

