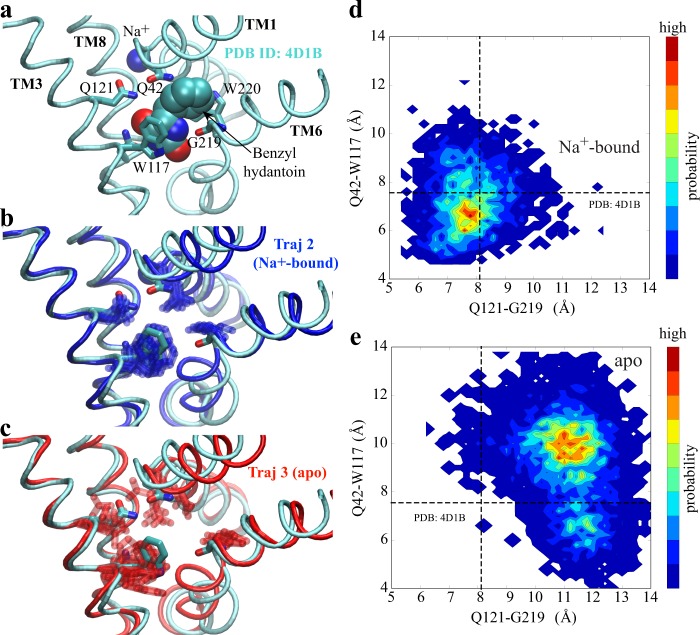
Figure 3.
Na+-binding effect on the local conformation of the substrate-binding site in the OF state. (a) Conformation of the substrate-binding site in the OF Na+/substrate-bound crystal structure (PDB ID code 4D1B). The substrate is shown in VDW representation, the substrate-binding residues in stick, and the substrate-binding relevant helices in cyan tube. (b and c) Conformational dynamics of the substrate-binding site in Na+-bound (B, dark blue) and apo (C, red) trajectories. The substrate-binding residues are shown in overlapped sticks from several snapshots taken every 750 ns from respective trajectories. For clarity, only one typical conformation of the substrate-binding helices is shown in either blue (Na+-bound) or red (apo) tube, with the Na+/substrate-bound crystal structure shown in cyan. (d and e) Local Conformational fluctuations within Na+-bound (d) and apo (e) trajectories. As important indicators of the binding affinity, the center-of-mass distances are measured between Q121 and G219 as well as Q42 and W117. The dashed lines indicate the corresponding distances measured in the OF Na+/substrate-bound crystal structure (PDB ID code 4D1B).

