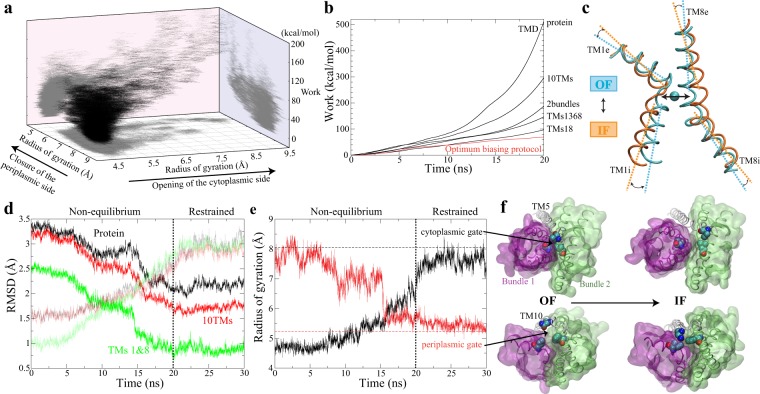
Figure 4.
Identification of the optimal protocol to induce the OF ↔ IF global transition. (a) 70 independent biased simulations were performed to explore the transition pathway. Trajectories are shown in the space formed by the radius of gyration of both periplasmic and cytoplamsic gates, and the associated nonequilibrium work. (b) Representative examples of biasing protocols to demonstrate how nonequilibrium work was reduced by optimizing the collective variables. The black lines represent the nonequilibrium work associated with simulations using RMSD as collective variables for different structural elements. The red line shows the nonequilibrium work of simulation using the optimal protocol with collective variables shown in (c). (c) The collective variables used in the optimal protocol: the distance between TM1 and TM8, the angle between TM1e and TM8e, and the angle between TM1i and TM8i. The differences of these collective variables between OF and IF states are shown in the comparison of two Na+-binding helices, TMs 1 and 8, between OF Na+-bound (PDB ID code 2JLN) and IF apo (PDB ID code 2X79) crystal structures. (d) The backbone RMSDs of different structural elements during the biasing simulation with the optimal protocol and the following restrained simulation, respectively with reference to OF Na+-bound (PDB ID code 2JLN) (dark lines) and IF apo (PDB ID code 2X79) (semi-transparent lines) crystal structures. (e) The radius of gyrations of cytoplasmic (black) and periplasmic (red) gates in the same trajectory shown in (d). The radius of gyration of the two gates in IF apo crystal structure (PDB ID code 2X79) are shown as horizontal dashed lines. The cytoplasmic gating residues include I161, I230, and L320, and the periplasmic gating residues include I47, F120, and N360. (f) The opening of the cytoplasmic gate (top), and the closure of the periplasmic gate (bottom) during the OF to IF transition. The gating residues are shown in VDW, and the two bundles are shown in transparent surfaces. TM5 and TM10 are shown as white tubes.

