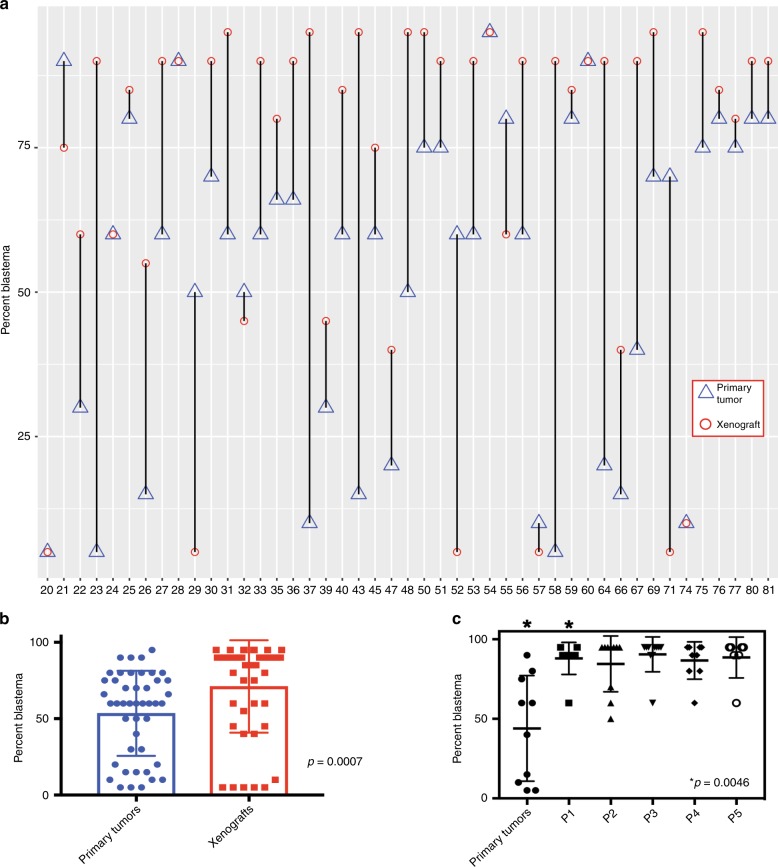
Fig. 3. Early-passage WTPDX enrich for blastema by histology.
a The percentage of blastema is plotted for primary tumors (triangles) versus corresponding early-passage xenografts (circles), demonstrating that most xenografts enrich for the blastemal component by histology. b A significant increase in the percentage of blastema by histology was found when the entire group of primary tumors versus early-passage xenografts were compared. c The percent blastema was compared between nine triphasic primary tumors and the first five passages of corresponding WTPDX (P1-P5). A significant increase in percent blastema was found at the first passage and maintained through passage 5. Error bars in b and c represent mean ± standard deviation. P values are from a paired two-tailed t-test.

