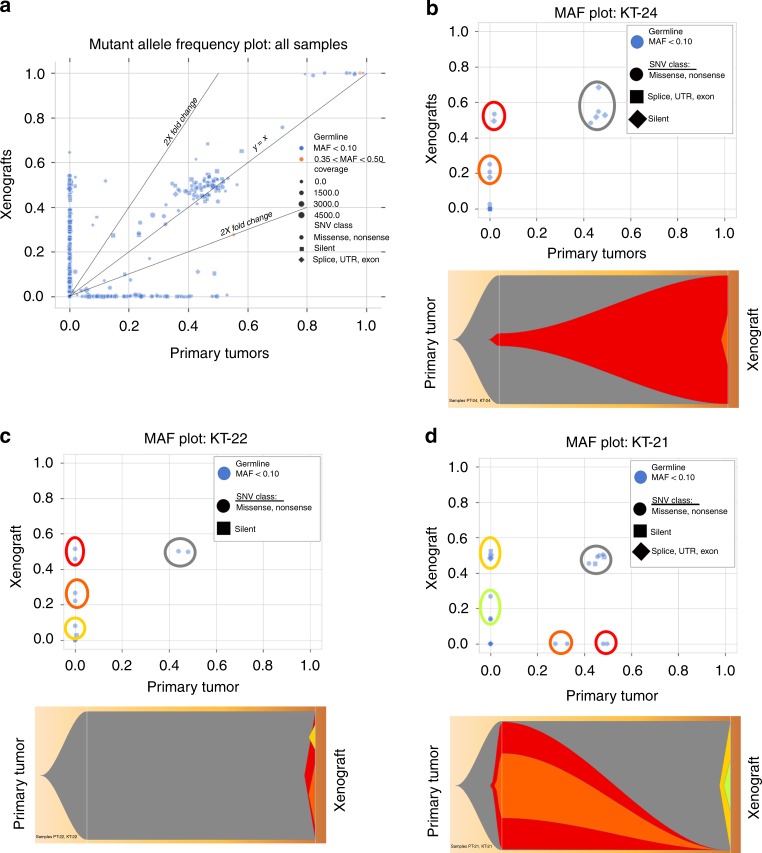
Fig. 4. Subclonal analysis of WTPDX and parent primary tumors.
a Mutant allele frequency (MAF) plot of the entire target capture validation sequencing dataset depicts clones of mutant alleles shared between WTPDX and primary tumors (along slope y = x line), clones enriched or depleted in the xenografts (2× fold change lines depicted), and clones represented in the primary tumor or xenograft, but not both (clustered along x and y axes). b MAF and Fish plots show that KT-24 demonstrates maintenance of a major clone from the associated primary tumor (gray), expansion of a minor subclone from the primary tumor into a major clone in the xenograft (red), and the presence of a xenograft-specific subclone (orange). c KT-22 demonstrates maintenance of the major clone from the primary tumor (gray), with emergence of xenograft specific clones (red, orange, and yellow). d KT-21 demonstrates maintenance of the major clone from the primary tumor (gray), loss of clones from the primary tumor (red and orange), and emergence of xenograft-specific clones (yellow and green).

