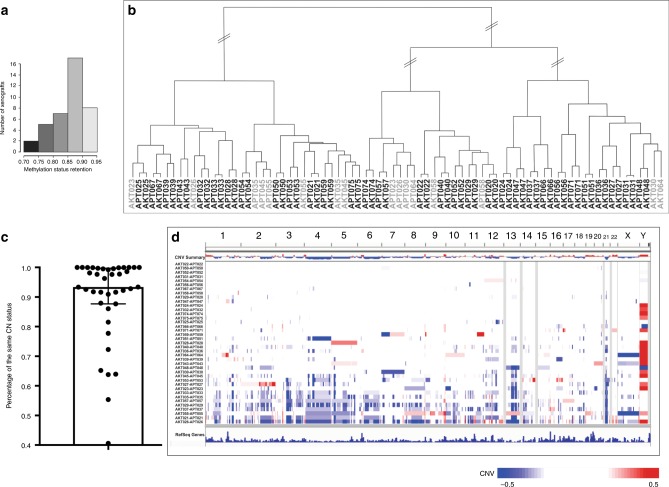
Fig. 6. Global methylation and chromosomal copy number analysis.
a Methylation retention status of the WTPDX–primary WT pairs ranged from 0.7248 to 0.9167 (median 0.8678). b Hierarchical clustering of primary tumors and xenografts according to global methylation status of the top 20,000 most variable CpG site probes in the dataset resulted in the clustering of 31 of 39 xenograft–primary tumor pairs immediately adjacent to each other (matched specimens shaded in black). c Boxplot representation (median with tails representing interquartile range) of the percentage of shared copy number status between primary tumors and xenografts. d Differential genome-wide chromosomal copy number status comparing primary tumors and xenografts. Each row represents a xenograft–primary tumor pair. Chromosome numbers are given across the top. Blue indicates chromosomal copy number loss in xenografts relative to primary tumors, and red indicates copy number gain. Some xenografts (bottom of graphic) had accumulation of copy number losses (blue) compared with paired primary tumors.

