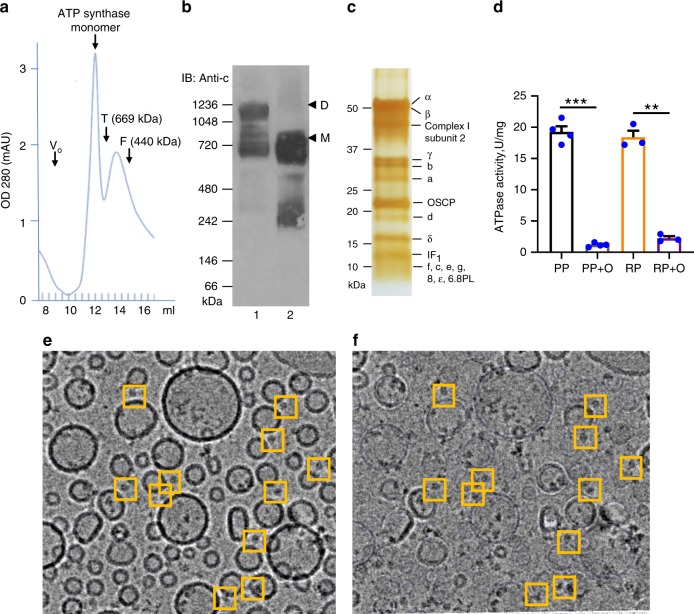
Fig. 1. DDM-purified ATP synthase forms monomers.
a Size exclusion chromatography (SEC) profile of purified ATP synthase monomer. A representative example of three independent runs is shown. Void volume of SEC column (Vo) and elution volume of protein molecular weight markers, thyroglobulin (T, 669 kDa) and ferritin (F, 440 kDa) are shown. b Blue-native PAGE and immunoblot analysis of porcine heart mitochondria solubilized with digitonin (sample 1) and porcine ATP synthase purified from DDM-solubilized mitochondria (sample 2). ATP synthase c-subunit antibody was used to detect monomeric (M) and dimeric (D) ATP synthase. Molecular weight markers are indicated on the left side of the gel. Representative blot of three independent experiments is shown. c SDS-PAGE analysis of DDM-purified monomeric ATP synthase after reconstitution in small unilamellar vesicles. Silver stain was used for protein band visualization. Molecular weight markers are indicated on the left side of the gel. All bands are identified based on confirmation either by LC/MS/MS or immunoblot analysis (Supplementary Fig. 1d, Supplementary Data 1). d ATP hydrolysis activity of purified ATP synthase, per mg protein, before and after reconstitution into lipid vesicles. PP and RP refer to purified protein and reconstituted protein, respectively; O refers to oligomycin. Oligomycin-sensitive ATP hydrolysis activity was measured to assess the coupling of purified protein (n = 4 for PP and n = 3 for RP, ***P < 0.05, **P < 0.05, paired t test was used, error bars refer to SEM). e Micrograph showing the cryo-EM images of monomeric ATP synthase reconstituted into small unilamellar vesicles before and f after vesicle subtraction. Each yellow box (125 × 125 Å) indicates one ATP synthase particle pointing out of the lipid vesicle. Vesicles were frozen on C-flat grids covered with a thin carbon layer (5–8 nm). The source data underlying b, c, d are provided as a Source Data file.

